Correlating Agent Traces to Business Transactions
Connecting AI agent traces to business outcomes requires deliberate instrumentation strategy.
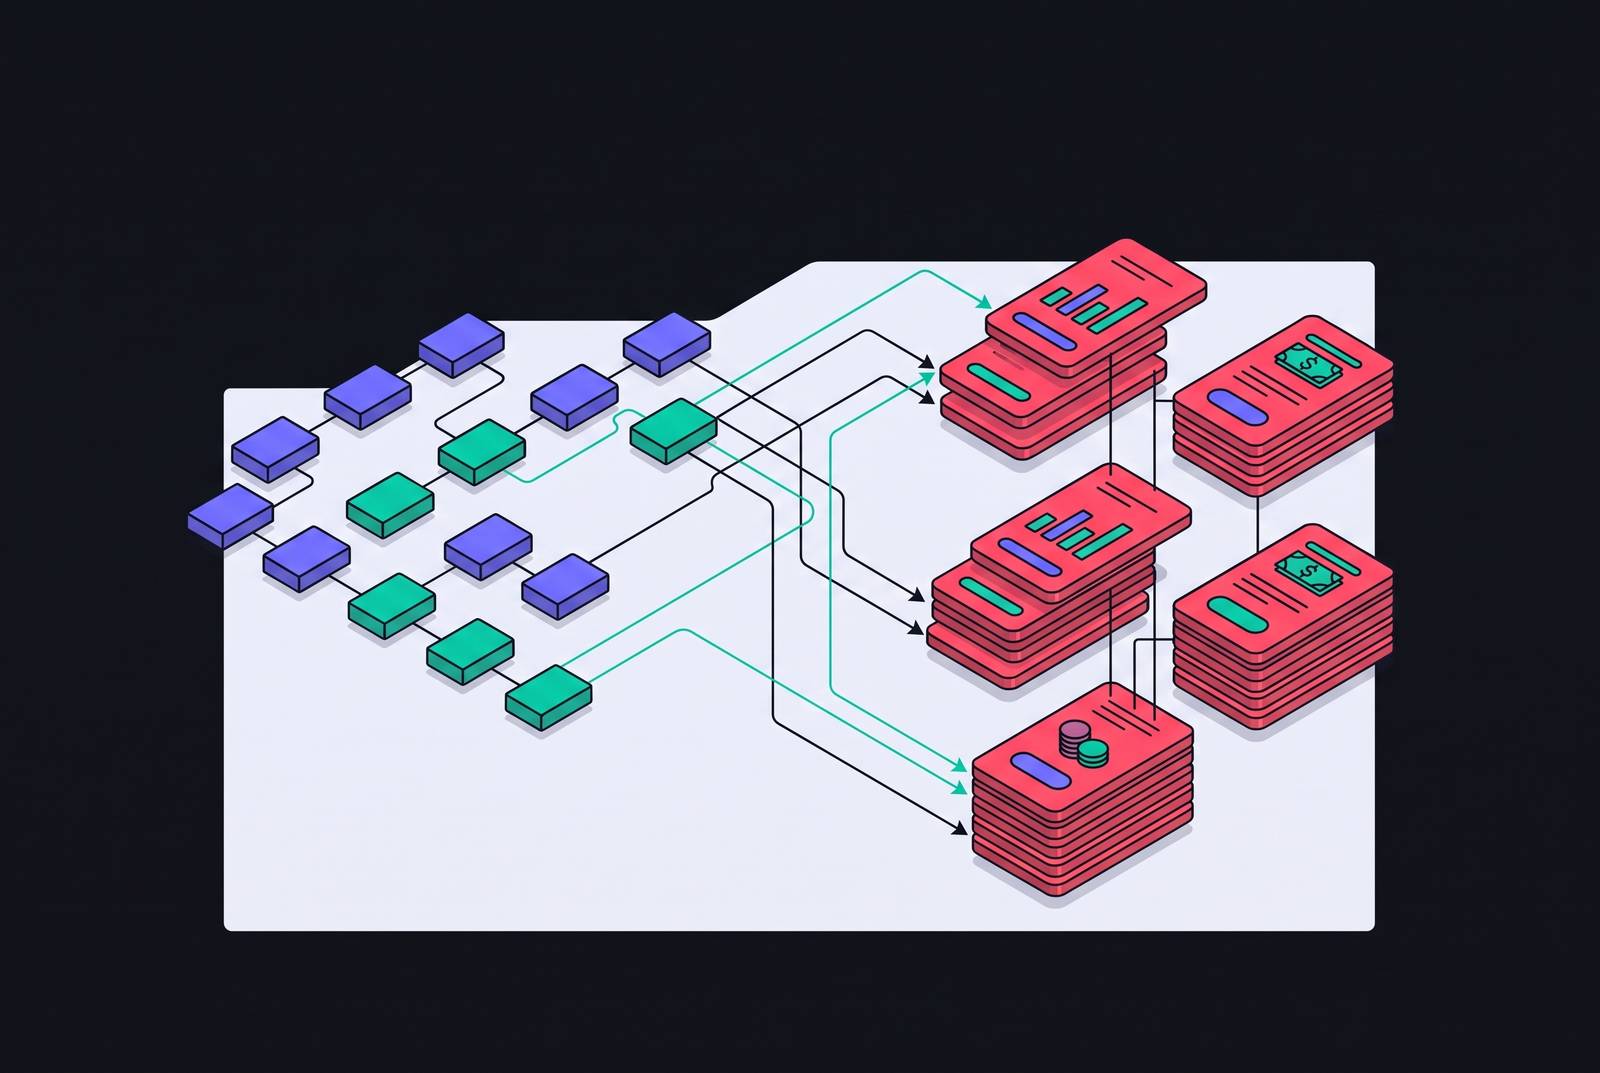
Agents now execute multi-step transactions across engineering, finance, product, and sales, acting less like assistants and more like autonomous employees with API keys. That shift creates a measurement problem nobody quite solved before it became urgent. Traditional application performance monitoring hands back CPU load, memory usage, HTTP status codes, error rates, and the whole familiar dashboard, and none of it says the agent made the right call, picked the right tool, or produced anything a business would pay for. A trace can tell you exactly what happened inside the model. It cannot tell you which customer transaction that action touched, whether the transaction closed successfully, or what it cost the company to find out.
That gap is not cosmetic. Gartner's projection holds that more than 40% of agentic AI projects get canceled by the end of 2027, and the reasons cited (spiraling cost, unclear business value, weak risk controls) are measurement failures dressed up as technology failures. Separate research out of MIT, widely cited in trade coverage, found that 95% of AI investments show no measurable return, and the researchers were explicit that this is a measurement and communication problem, not a technology problem. The models mostly work. Organizations just can't prove it, and provability is the whole game once budget owners start asking questions.
Fixing that requires a deliberate instrumentation strategy. The rest of this piece works through that strategy layer by layer, from what a trace captures by default, to the schema that makes cross-system correlation possible, to the business metadata that turns a technical record into an accountability record, and finally to the platforms built to hold all of it together. Correlating Agent Traces to Business Transactions.
What a trace captures and omits by default
A trace is the causal history of one request moving through an agent system, made up of nested spans that all share a trace ID. A span is a single timed operation with a timestamp, a status, a reference to its parent, and a bag of metadata attributes. Simple enough on paper.
Agents complicate it because every discrete reasoning tick generates its own span, and those spans stack hierarchically. A parent trace for one full agent run contains child spans for every LLM call, every tool invocation, every memory read or write, and every handoff between sub-agents. Reasoning chain spans, where available, carry the intermediate thought text, the decision branch taken, and a confidence score.
That is a genuinely rich record. It is also, by default, business-blind. No transaction ID. No workflow label. No business domain. No KPI tag anywhere in sight. The trace is semantically complete at the model level and semantically empty at the business level. Engineers can replay a failing trace and understand every token that moved through it. Nobody can look at that same trace and answer which customer order it affected, because the schema was never asked to hold that information in the first place. Handoff spans capture source agent ID, target agent ID, context payload size, and transfer latency.
The common schema that makes cross-system correlation possible: OpenTelemetry GenAI semantic conventions
Correlation across systems needs a shared vocabulary, and that vocabulary now exists. That graduation matters less as a ceremony and more as a signal: this is now infrastructure, not a side project.
The scope has since widened to cover agent orchestration, MCP tool calling, workflow composition, content capture, and quality evaluation, six layers in all (per Greptime). The conventions moved into their own dedicated repository in June 2026, alongside the core semantic-conventions v1.42.0 release, and they carry independent versioning while remaining formally in Development status OpenTelemetry. Translation: the foundation is usable today, but treat it as a living spec, not a finished one.
That caveat deserves serious attention. Core model-call and tool-call attributes had settled enough by early 2026 that instrumenting against them was a defensible bet, but agent and multi-agent semantics were still shifting, and instrumentation teams should expect attribute names in that layer to move under them. None of that undercuts the value of adopting the standard now. It just means the multi-agent portions of a schema deserve a version pin and a change log.
The payoff for correlation is direct. Because major cloud providers and observability platforms have adopted semconv, a span's gen_ai.* attributes land in the same backend that already ingests the application's HTTP and database spans. The AI trace stops being an island and becomes one branch of the same graph as the rest of the transaction. In a multi-agent system, a supervisor's span contains the sub-agent invocation spans it triggered, and because context propagation is standard OTel behavior, that tree holds together even when the sub-agents run in entirely different services. A tool that calls a downstream API produces an HTTP span underneath it using ordinary HTTP conventions, yielding a single readable end-to-end trace. One trace, fully readable, end to end.
Adoption costs are low for anyone using a mainstream provider. In Python, OpenAI tracing can be turned on with a single line, after which semconv-compliant spans get produced automatically. The remaining work sits in multi-agent systems specifically: every sub-agent execution has to extract the active trace ID from its parent process, and every tool call inside that sub-agent needs its own child span using gen_ai.tool.* attributes. Skipping that step breaks the hierarchy, quietly, in exactly the place debugging needs it most. OpenTelemetry GenAI Semantic Conventions define a standard schema for AI/LLM telemetry, backed by the CNCF, and OpenTelemetry graduated within the CNCF, per the Maxim AI source. This matters for correlation because semconv is adopted by major cloud providers and observability platforms, so gen_ai.* attributes on a span can be ingested by the same backend that receives the application's HTTP and database spans, placing the AI trace in the same graph as the rest of the transaction.
How business metadata tagging bridges the gap between spans and transactions
Standard logging tells an engineer what happened. It does not tell anyone which team drove a cost spike, whether sensitive data slipped out through a tool call nobody sanctioned, or which customer segment is quietly failing at a higher rate than the rest. Semconv alone can't answer those questions either, because none of them are technical questions. They're business questions wearing a technical costume, and answering them requires attributes semconv was never built to carry.
The fix is structural: attach business metadata directly onto spans. With that in place, a team can filter thousands of traces at once to isolate a failure pattern that would be invisible from any single trace on its own. Without it, the only option is replaying failing traces one at a time and hoping a pattern jumps out.
A team can query the exact failures it needs to see. Tagged, someone can query "show every trace where tool X failed for users in segment Y over the last 48 hours" and get an answer in minutes.
A workable tagging hierarchy runs four layers deep: identity (user ID, team ID, agent ID), workflow (workflow ID, transaction ID, session ID), business domain (strategy ID, use-case label, business unit), and outcome (success or failure flags, guardrail decisions, escalation flags, approval records). MLflow's guidance on timing is blunt: tag every span with at least one business-level attribute from day one, because adding user_id or workflow_id retroactively after a production incident is significantly more painful than instrumenting with that context from the start. Incidents are when the absence of it gets discovered comes later. They're when the absence of it gets discovered.
Tagging also connects traces to the data feeding the agent, not just the transaction it's part of. Atlan's MCP server links agent execution traces directly to its Enterprise Data Graph, mapping tool calls, retrieval steps, and model decisions to governed data assets, ownership records, and semantic definitions, which is what gives a trace business context rather than just technical context. Once traces connect to a governed context graph like that, they stop being raw event records and start functioning as governance artifacts, each tool call and data access tied to the asset, owner, and policy that were supposed to control it. Monte Carlo's Agent Observability connects OTel agent traces and configurable monitors to the data estate feeding them, helping teams determine whether stale context came from a late table, schema change, or upstream pipeline failure, per Confident AI's comparison.
Token cost attribution and multi-agent hierarchical traces as accountability structures
Cost attribution is a control, not a nicety. Tracking spend by team, feature, model, and user segment is the only way to catch budget overrun before it compounds across dozens of agents running in parallel. Revenium's model illustrates the pattern well: it tracks cost at the individual agent and customer level across multiple providers, so an organization can trace spend all the way from raw tokens to the business outcome those tokens produced. That's a meaningfully different capability than a provider's native usage dashboard, which shows total consumption but rarely breaks it down by who spent it or why.
Scale changes what's possible here. Past roughly 1,000 agent runs a day, no human review process keeps up, and automated pattern detection becomes the only realistic way to spot which retrieval queries keep returning low-quality results or which tool-call sequences reliably precede failure. Below that threshold, a sharp engineer with a query console can eyeball it. Above it, the eyeballing stops working and the system needs its own instrumentation to do the noticing.
Hierarchical trace models earn their keep here. When a root cause in one sub-agent cascades through several downstream steps, a hierarchical view is what lets someone pinpoint where the failure actually started, rather than where it happened to surface. Without that view, debugging a multi-agent pipeline turns into a guessing game dressed up as an investigation. Unifying AI-specific spans with standard service traces extends the same logic outward: SRE teams can correlate a slow LLM response with a database bottleneck or a Kubernetes networking hiccup, which matters enormously for holding SLOs in regulated industries where "the AI was slow" is not an acceptable postmortem line.
That means decades of established business process analysis techniques, built for auditing supply chains and workflows, apply directly to agent trace data without needing a bespoke toolchain. The overlap is not a coincidence so much as a convenience: agents behave like business processes, so it turns out the tools for auditing business processes work on them too. A 2026 preprint titled "Agent Behavior Mining: Generative AI Agent Governance in Business Processes" (arXiv:2606.20669) describes an event data model where most ai:* attributes align with OTel GenAI semantic conventions, with corresponding event logs usable by process mining tools supporting the XES standard, meaning standard business process analysis techniques can be applied directly to agent trace data.
The business KPIs that traced agent behavior must connect to
Most enterprises default to efficiency metrics when they measure agent performance, and revenue impact measurement lags well behind at around 25%. That's a strange ordering of priorities for a technology sold on business transformation, but it reflects a simpler truth: efficiency metrics are easy to pull from a token count, and revenue attribution requires actually connecting the trace to the transaction system, which is exactly the harder work this piece has been describing.
Financial KPIs sit at the center of the case. Cost per Interaction, the fully loaded cost of one agent-handled transaction including LLM spend, infrastructure overhead, and any human escalation, becomes derivable once token attribution spans carry workflow and transaction tags. Revenue Influenced, meaning how agent interactions move sales, retention, or expansion, requires linking trace outcomes to CRM or order-management transaction IDs, which is only possible if those IDs were tagged onto the span in the first place. On the customer experience side, First Contact Resolution measures whether an issue gets solved on the agent's first attempt, correlates strongly with satisfaction, and directly lowers cost per interaction, and it's traceable straight from the escalation-flag attributes sitting on handoff spans.
Operational quality KPIs round out the set: success rate (the share of runs completing without errors, hallucinations, or policy violations), hallucination rate broken out by domain and query type, and token usage efficiency, which surfaces context construction patterns that are quietly wasting money on every run.
Pay-i, cited by LangChain, shows what a fully connected version of this looks like in practice. It looks across multiple agents to tie the cost of every GenAI use case to a measurable business outcome, works out what "success" actually means for that specific workflow, sets industry-appropriate KPI targets, and tracks the use case against those targets continuously. Arthur's 2026 observability playbook states the underlying design principle: the architecture has to enable correlation across agent steps, tools, upstream data, and downstream outcomes to support root-cause analysis, because KPIs without that correlation trail are just metrics with no evidence behind them. A number without a trace to back it is a claim, not a measurement.
What a complete instrumentation strategy looks like end to end
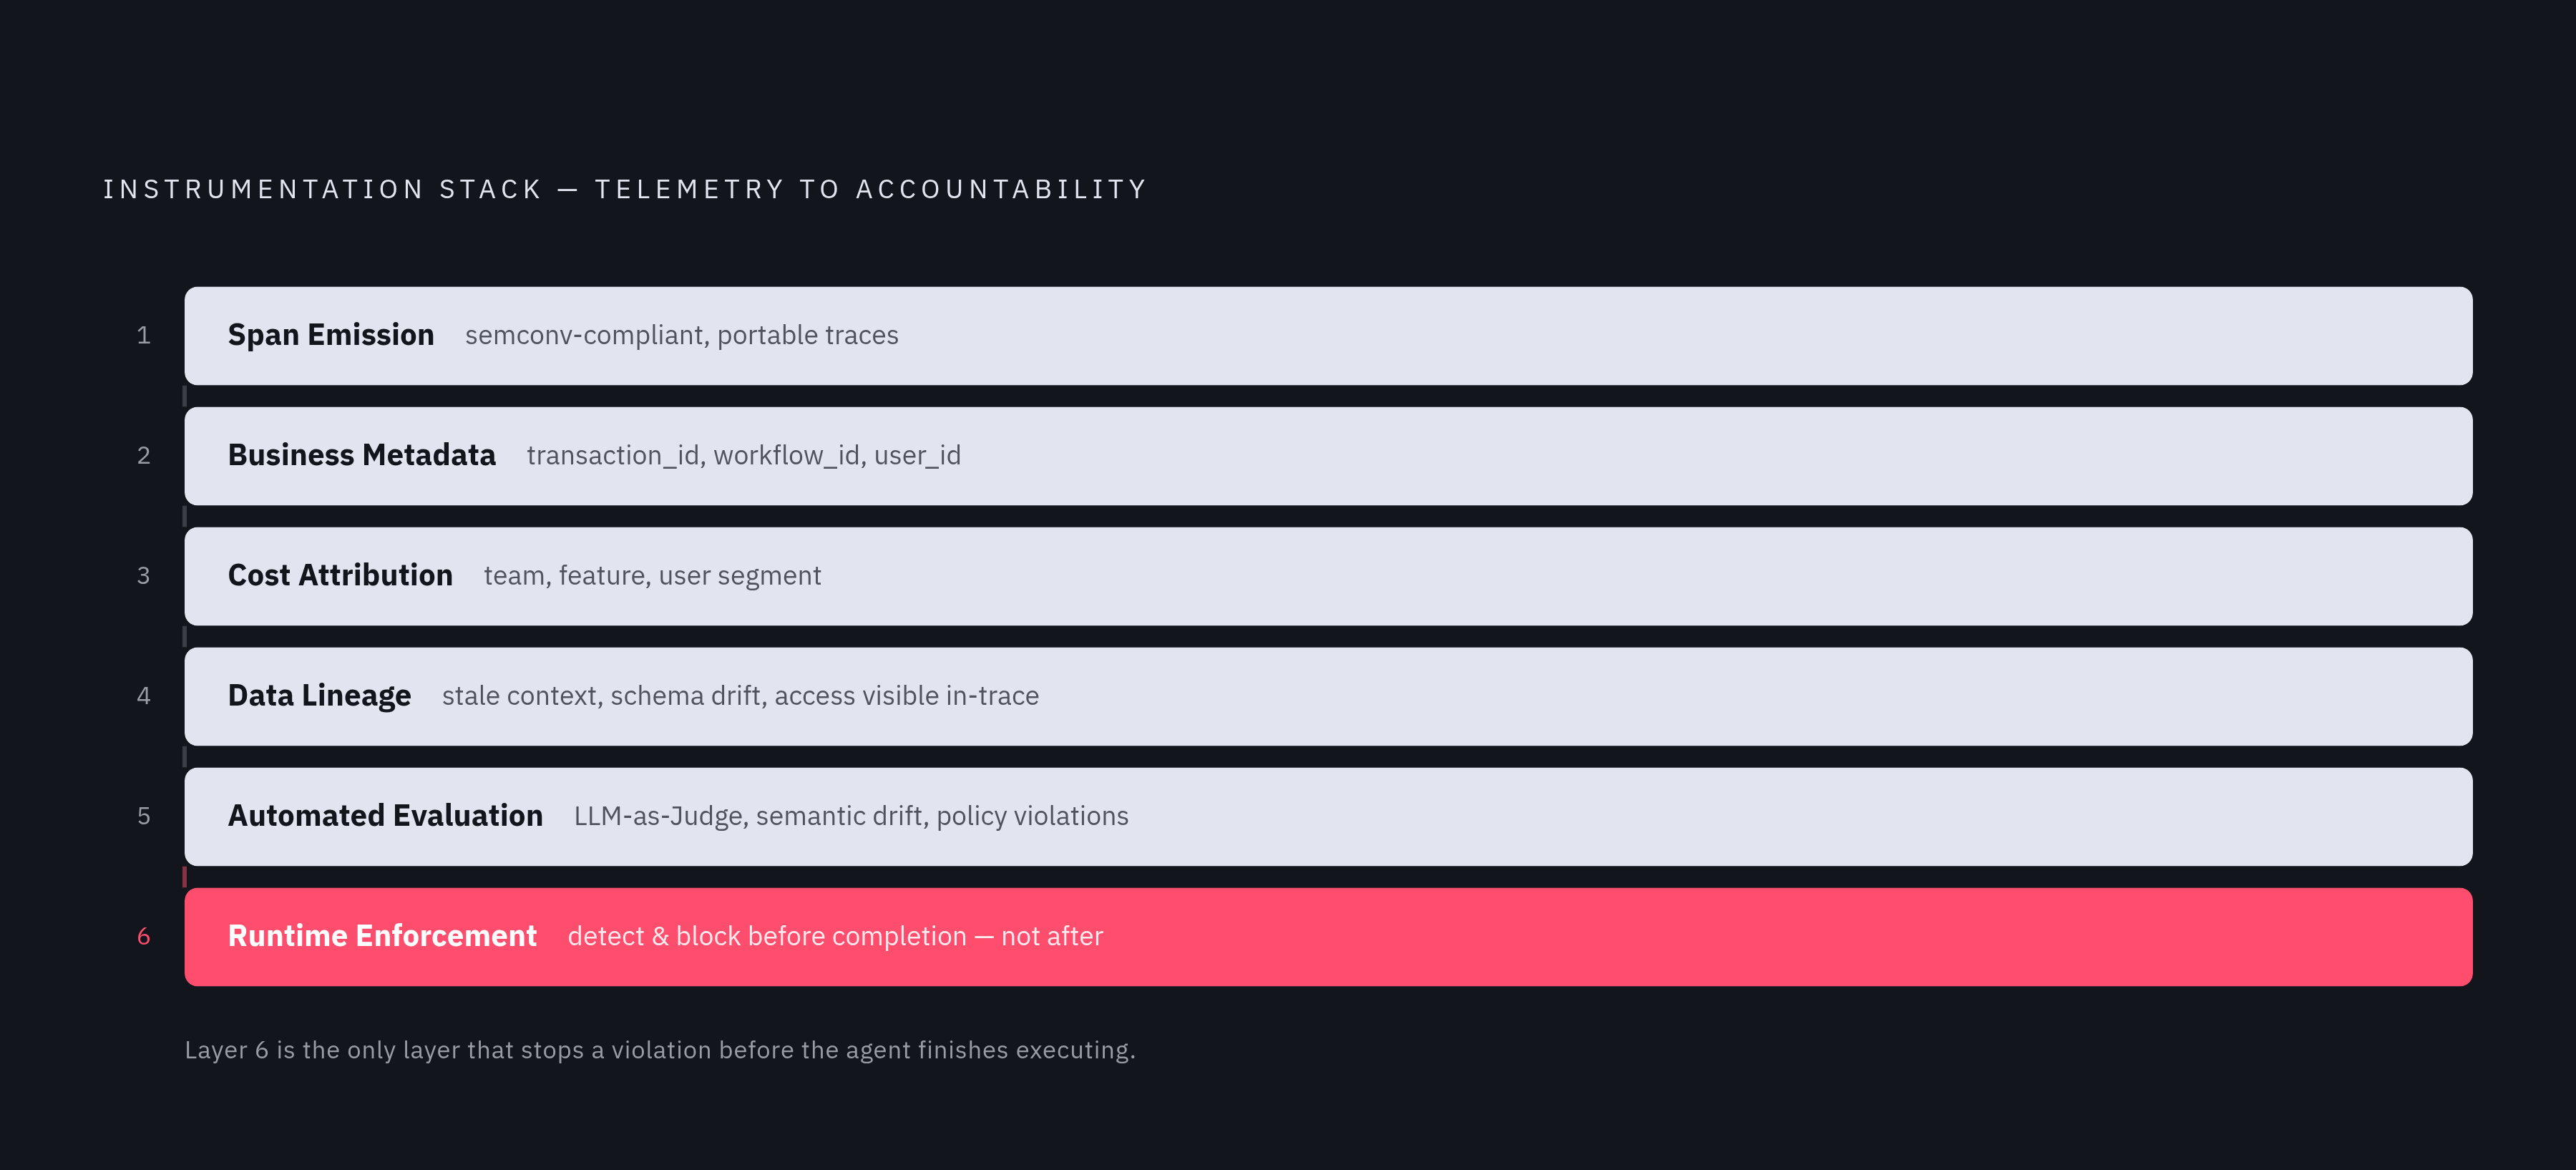
Six layers, stacked. Layer one emits semconv-compliant spans from the start, so traces stay portable across backends and joinable with the rest of the application's non-AI spans. Layer three handles cost attribution by team, feature, and user segment, rolling token spend up to business units so it can sit next to outcomes for comparison instead of getting buried as undifferentiated infrastructure cost.
At layer four, traces connect to data lineage, so a stale context, a schema change, or an unauthorized data access appears inside the same trace as the agent action that consumed it. Layer five runs continuous evaluation, an automated LLM-as-a-Judge pass against sampled production traces, catching semantic drift, factual error, and policy violation before any of it reaches a business outcome. Layer six is runtime policy enforcement, existing because logging and evaluation are both retrospective by nature. Production safety needs the ability to detect and block a violation before it completes, since an audit log can explain what went wrong only after an agent has already executed a transaction with access it should never have inherited.
Stacking telemetry, cost, quality evaluation, and policy records together produces complete audit logs of every action an agent takes on the organization's behalf, which is what regulated industries require to pass audits and what leadership requires to scale with confidence. Right now, only around 15% of GenAI deployments instrument observability at all, with one forecast putting the figure at 50% by 2028. That gap between what's possible and what's actually built is a central fact of the current landscape. It's the competitive window, open right now, for anyone willing to do the tagging work everyone else keeps deferring. Layer 2, business metadata tagging at every span, means instrumenting with transaction_id, workflow_id, user_id, and business-domain labels before any agent reaches production, since retroactive tagging after an incident is the painful alternative.
Evaluating the platforms that support trace-to-transaction correlation in 2026
Judging a platform on this problem means checking it against a short list of hard requirements. Complete trace visibility across the full agent hierarchy comes first: can it show every span from LLM call down to the HTTP request a tool triggered underneath, in one connected view. Agent-step evaluation comes second, the ability to score individual reasoning steps and tool calls rather than only the final output. Trace-level metrics tied to actual business outcomes matter just as much, since a platform that stops at latency and token count is still only half-instrumented no matter how polished its dashboard looks.
Multi-agent and handoff visibility separates the platforms built for single-agent chatbots from the ones built for the orchestration systems enterprises are actually running now. Anomaly detection at the volume where human review stops working (that roughly 1,000-run-a-day threshold) is what makes a platform usable at production scale rather than merely at demo scale. And trace-to-dataset linkage, connecting the trace back to the governed data asset an agent touched, turns a technical monitoring tool into a governance tool a compliance team can rely on.
None of these criteria are exotic. They're just the direct consequence of everything above: a trace without business metadata is a technical curiosity, and a KPI without a trace behind it is an assertion. The platforms to evaluate in 2026 are the ones built around closing that specific gap, not the ones that got there first.
Sources
- Understanding AI Observability in 2026 and Why It's Essential
- AI Agent Observability: A Complete Guide for 2026 & Beyond
- Top 8 AI Agent Observability Platforms for 2026 - Confident AI
- Agentic AI Observability: A 2026 Playbook | Arthur
- AI Agent Observability: Tracing, Testing, and Improving Agents
- How OpenTelemetry Traces LLM Calls, Agent Reasoning, and MCP Tools | Greptime
- OpenTelemetry GenAI Semantic Conventions | MLflow AI Platform
- GitHub - open-telemetry/semantic-conventions-genai · GitHub