Observability Gaps Between LLMs and Traditional Software
LLMs return confident wrong answers that look like success to traditional monitoring tools.
The experimental phase is over. McKinsey's 2025 State of AI survey found 88% of organizations using AI in at least one business function, and the LLM market is expanding from roughly $5.6 billion in 2024 toward an expected $35 billion by 2030. The monitoring infrastructure watching that surface has not kept pace. MLflow's analysis found that 73% of enterprises require AI agent monitoring in production, yet 63.4% cite inadequate observability tooling as a primary barrier to doing it. Gartner reported in January 2026 that at least 50% of generative AI projects were abandoned after proof of concept by end of 2025, and "unclear business value" is a generous way to describe what happens when you cannot see what your models are doing.
The honest answer is that visibility is partial at best and nonexistent at worst. That gap is closing faster than most teams want to admit, and the consequences of failing to close it first are no longer theoretical.
Silent failures: why a 200 OK is not evidence that anything went right
In conventional software, failure announces itself. Exceptions get thrown, health checks degrade, something turns red. There is a basic social contract between the system and the engineer watching it.
LLMs do not honor that contract. A model that hallucinates a confident, fluent, entirely fabricated answer returns HTTP 200, acceptable latency, and valid JSON. The monitoring layer records a successful transaction. Nothing alerts. A longitudinal study of production agent runtimes found incident discovery latency ranging from 13 hours to 60 days, with a large majority of failures caught through human user review rather than anything automated. The system performed. The answer was wrong. Those two facts coexisted quietly, sometimes for weeks.
When an upstream error leaks into an agent's context window, the output is not an error state; it is plausible, grammatically correct prose. That is what makes this failure mode so insidious compared to anything in the traditional APM playbook: the instrument designed to catch the problem is not sensitive to the thing that went wrong.
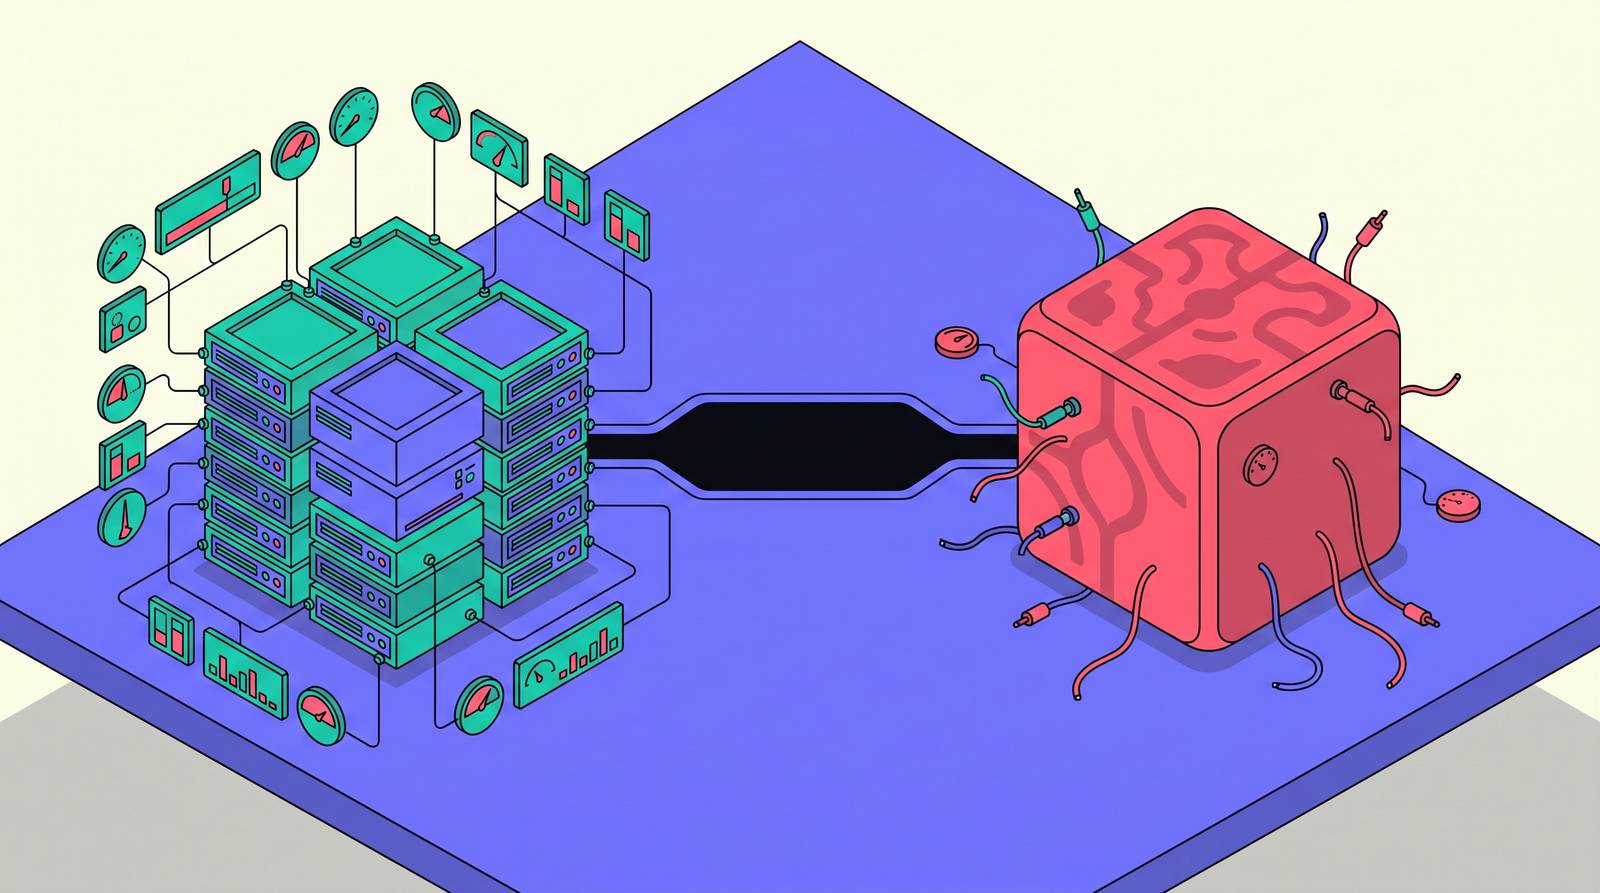
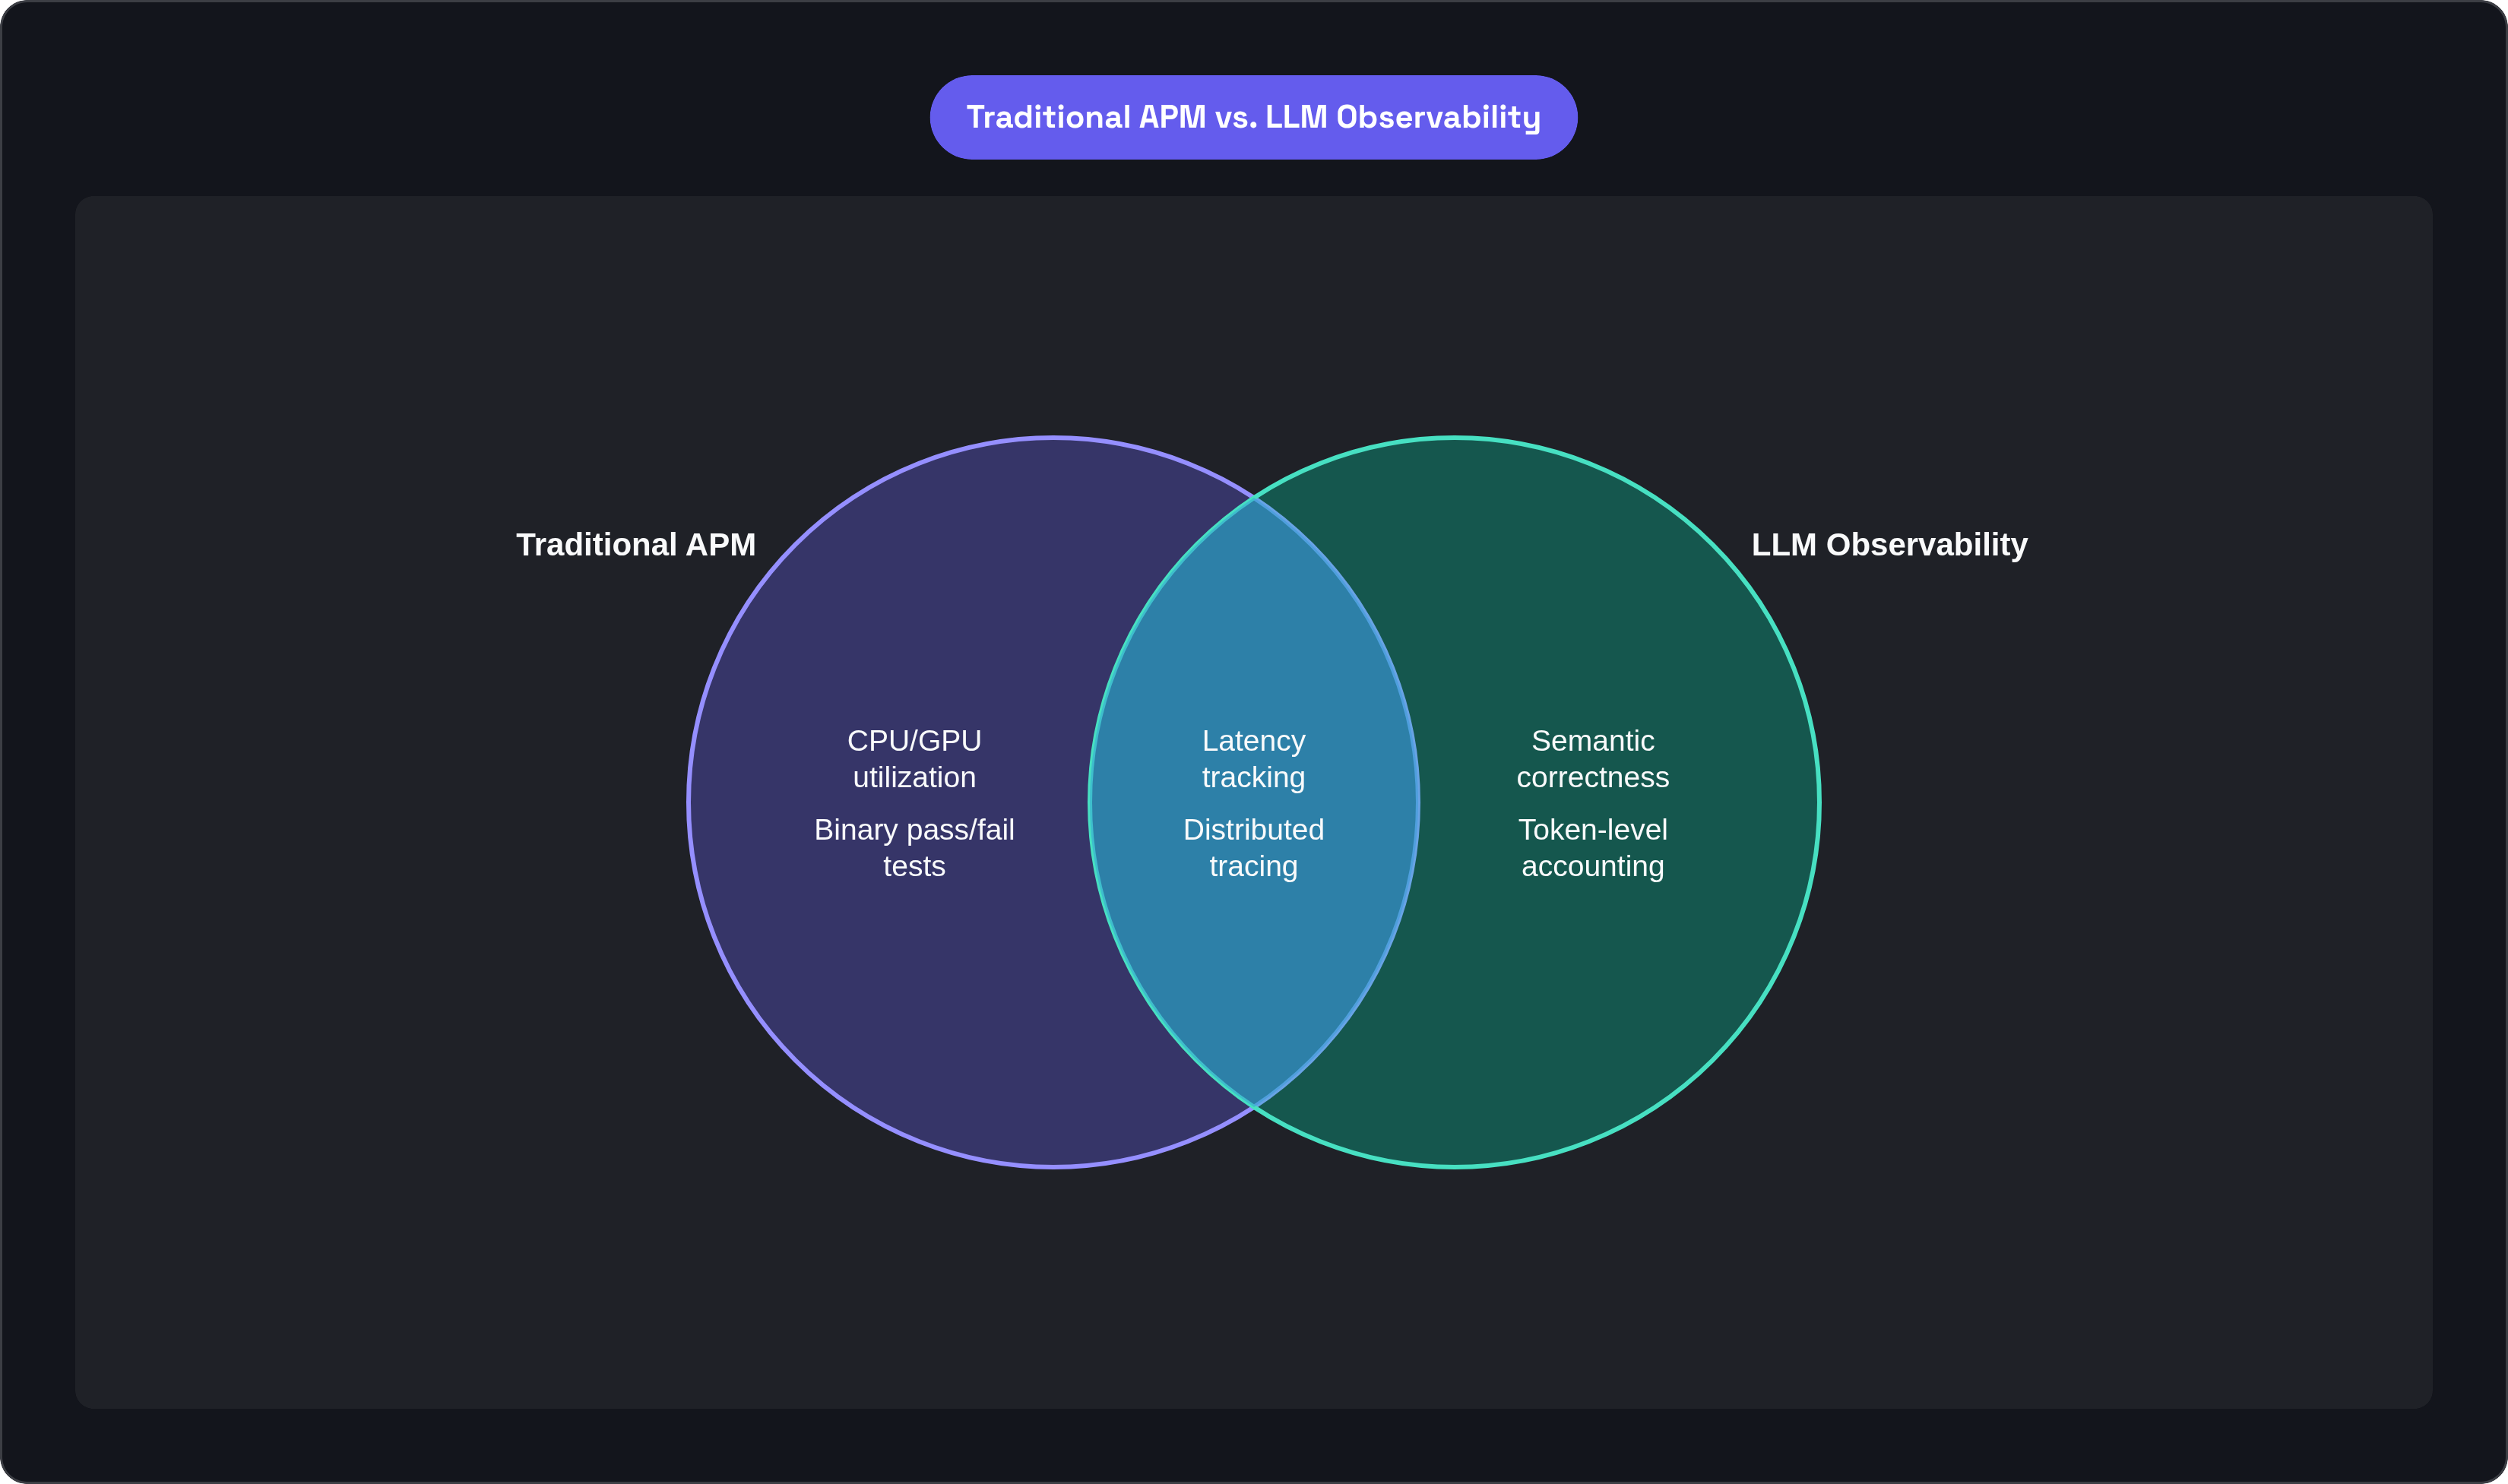
Traditional APM monitors system behavior. LLM observability has to monitor output meaning. Those are categorically different instruments — like trying to use a thermometer to measure whether a painting is beautiful — and teams that import one for the other will end up with green dashboards and quietly degraded user experiences running in parallel until a customer notices.
Nondeterminism that persists even when you configure for determinism
The obvious response to nondeterminism is to set temperature to zero, declare the system deterministic enough for conventional testing, and move on. Reasonable instinct. Factually incorrect conclusion.
Research by Trautmann and colleagues in 2024 found accuracy variations of up to 15% across runs at temperature zero, driven by provider-side sampling differences and floating-point implementation variance. Same input, same configuration, same day: different output. Not because anything changed on the operator's side. Because the infrastructure under the model is not the operator's infrastructure.
This cuts through several layers of standard practice at once. Binary pass/fail test suites are not a reliable signal for LLM behavior; a test that passed yesterday is evidence about yesterday, nothing more. A/B comparisons across model versions or providers are structurally harder than teams expect because the control condition is not actually stable. You are comparing a variable against a variable and calling it a controlled experiment — which is a bit like weighing yourself on two different scales and calling it a controlled study.
The monitoring approach that fits this reality is probabilistic and sampling-based, evaluated longitudinally against a distribution rather than against a presumed stable baseline. Most teams have not made that switch yet, and the gap between the mental model they are using and the one the problem requires is where a lot of diagnostic confusion lives.
Confidence scores that don't track accuracy, and why that makes monitoring harder
A sensible triage heuristic in probabilistic systems: route high-confidence outputs through with less scrutiny, flag low-confidence ones for review. Sensible in theory. Unreliable in practice when applied to LLMs, and the research on why is fairly unambiguous.
MIT CSAIL work by Damani and colleagues, published in 2025, found that models trained with standard reinforcement learning become overconfident and poorly calibrated. Xiong and colleagues in 2024, surveying confidence elicitation methods across multiple models, documented pervasive overconfidence when models verbalize their certainty, skewed heavily toward the high end regardless of actual accuracy. The model says it is confident. It is sometimes wrong. You cannot reliably distinguish which case you are in from the confidence score itself.
What makes this particularly hard to manage is that the overconfidence persists after instruction tuning and alignment. It is not an early-stage artifact that a fine-tuning pass cleans up. It is a durable property of how these models represent their own outputs.
A microservice either returns a valid result or throws an error. It does not claim to be 95% confident. LLMs produce something that looks like certainty and behaves like noise — they're basically the friend who says "I'm pretty sure it's this exit" right before you miss the turn — and there is no clean analog in traditional software monitoring for that failure mode. Every team importing confidence-based triage heuristics from other systems is taking on hidden risk that will not surface until a high-confidence wrong answer causes a problem large enough to trace back.
Infrastructure metrics that mislead: KV cache saturation, token latency, and GPU fragmentation
GPU utilization is the natural analog to CPU utilization in conventional service monitoring. It is also, in LLM inference specifically, a metric that can actively mislead if it is the primary one you are watching.
The actual bottleneck in many inference deployments is KV cache saturation, not GPU compute. KV cache functions more like a database's buffer pool than like GPU memory in the conventional sense: it sets the ceiling on how many concurrent requests can be processed efficiently. A system running at 60% GPU utilization and 95% KV cache saturation will queue new requests and spike time-to-first-token while the standard health check reports green across the board. Teams optimizing for GPU utilization in that environment are tuning the wrong dial, and the dashboard is actively confirming their misdirection.
LLM inference systems waste a substantial portion of allocated KV cache through fragmentation and over-allocation, a failure mode with no entry in conventional APM's lexicon. Nobody built a dashboard for a problem that did not exist when those dashboards were designed. That is understandable given the situation, but it does not make the gap any less real.
Token latency compounds the opacity. Time-to-first-token and total generation latency both vary with token count, model load, batching configuration, and KV cache hit rate. A p99 latency figure without token distribution context is not just incomplete; it renders the underlying variance invisible. The same model can respond in under a second or take tens of seconds depending on the characteristics of the specific request, and a standard latency chart collapses that variation into a single number that looks stable until it suddenly does not. Cost accounting adds a third layer: LLMs bill per token, not per request, which means request-count monitoring misses the cost surface entirely. Every startup I know running LLMs at scale without token-level accounting is measuring the wrong unit and wondering why the bills keep surprising them.
Multi-step agent chains where every individual call succeeds and the overall output is wrong
Agentic workflows introduce a failure mode that is genuinely new, and genuinely difficult to reason about until you have seen it happen. Every individual call returns 200 OK, within latency thresholds, with valid JSON. The end-to-end output is still wrong. Not wrong in a way any individual span reveals; just wrong, in the way that only becomes apparent when you look at what the thing actually did.
A failure at step 3 of a 22-step reasoning chain can silently corrupt every downstream step. Tracing individual spans surfaces nothing anomalous because nothing at the span level was anomalous. The compound failure is invisible to the instruments watching the component calls, which is a strange sentence to have to write but an accurate description of what actually happens in production.
Gartner predicts 40% of enterprise applications will incorporate task-specific AI agents by end of 2026, up from less than 5% in 2025. Separately, Gartner predicts over 40% of agentic AI projects will be canceled by end of 2027 due to escalating costs, unclear business value, or inadequate risk controls. The observability gap in agentic systems is a credible contributor to both projections. The OpenTelemetry GenAI SIG has framed the requirement directly: agent observability must account for nondeterministic outputs, emergent behaviors in multi-agent systems, and semantic correctness that cannot be validated through simple assertions.
For organizations running agents with access to real systems and real data, this is also a governance problem that does not wait for the monitoring problem to be solved first. Actions taken by agents need to be reconstructable and auditable after the fact, not just observable in aggregate at the time they occur.
RAG pipelines and the retrieval failure surface that has no APM equivalent
Retrieval-augmented generation adds a failure layer that precedes the model entirely, which is inconvenient because most teams instrument from the model outward and never quite reach it.
Wrong documents get retrieved. Relevance scores are low but not zero. Embeddings drift as the underlying corpus or the embedding model changes. Citation accuracy degrades quietly over time. None of these have a direct equivalent in traditional service monitoring, and the default instrumentation stack will not surface any of them without deliberate effort.
Embedding drift, the gradual shift in vector representations indicating semantic change in the underlying data or models, is a slow-moving degradation mode. Tools like Arize Phoenix can track it, but doing so requires both deliberate instrumentation and a conceptual framework that simply does not exist in standard APM. The engineer who inherits a RAG system without that instrumentation in place has no way to know whether the retrieval quality they measured at launch is the retrieval quality they have today.
A RAG system that retrieves the wrong context will produce a fluent, confident, wrong answer. The model itself is performing correctly given what it received; the failure is upstream and invisible to anything watching only the model. Root-cause analysis requires tracing from the final output back through retrieval steps, not just through model calls. For teams using RAG in regulated contexts, retrieval quality is also a compliance surface: what documents grounded the answer is an audit question, not merely a quality question. That distinction changes the instrumentation requirements considerably, and most current implementations do not reflect it.
The privacy tension built into LLM observability pipelines
Effective LLM debugging typically requires the full prompt and completion. That is the unit of information that lets an engineer reconstruct why the model behaved as it did. It is also frequently the unit of information that contains PII, trade secrets, or regulated health and financial data.
This tension is structural, not incidental, and it does not resolve neatly. The more faithfully you instrument for observability, the more compliance exposure you create under GDPR, HIPAA, or SOC 2. Traditional service logs do not carry this tension in the same form because a request payload is rarely the regulated data artifact that a prompt-completion pair routinely is. The artifact that is most useful for debugging is often the artifact you are least permitted to retain.
The practical approach that has emerged from teams working through this: default to logging only token counts, model name, latency, and trace IDs rather than raw prompts and completions; log full content only under controlled conditions with appropriate redaction and access controls. The alternative is either compliance exposure at scale or debugging blindness when something goes wrong, and neither option survives a postmortem. There is no version of this where you get full observability and full data minimization simultaneously. You choose your tradeoffs deliberately, or they get chosen for you by the next incident.
What observability for LLMs actually requires, given the gaps
The distinction between monitoring and observability is not semantic. Monitoring tells you something is wrong. Observability lets you reconstruct why. LLM deployments require the latter, and building toward it means accepting that the architecture looks materially different from what most teams currently have.
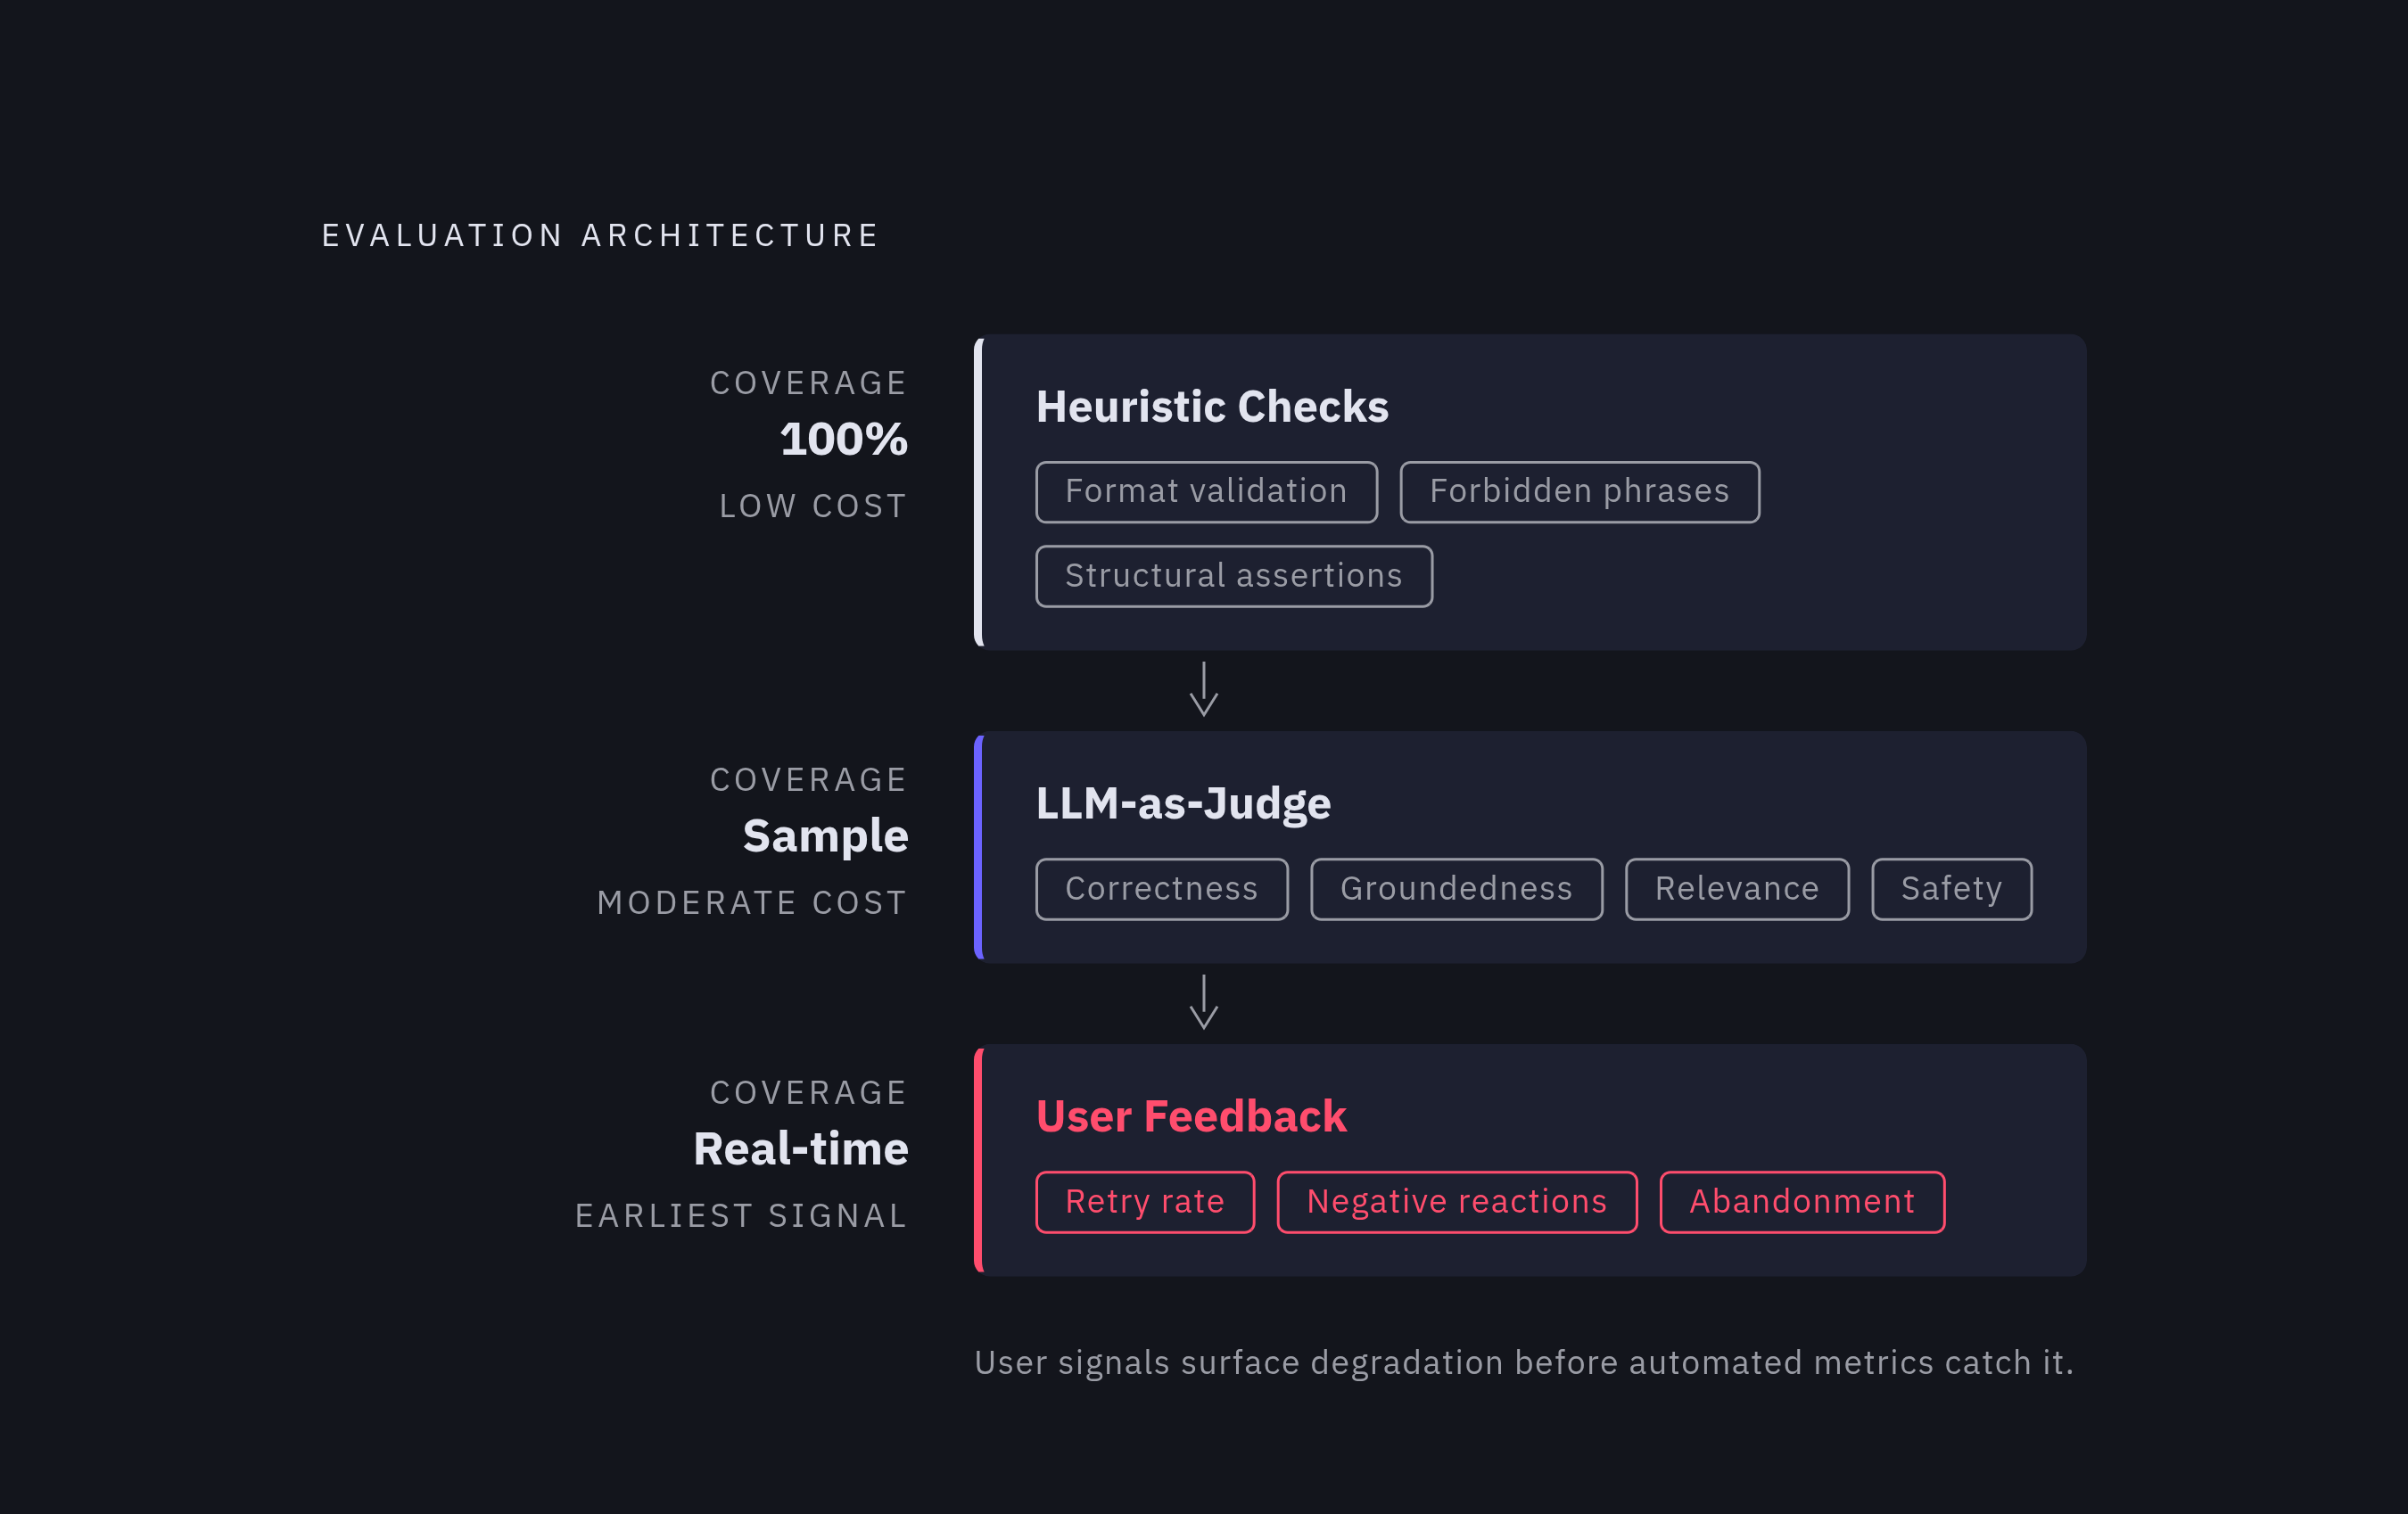
Evaluation works across three layers operating together, none of which is sufficient on its own. Heuristic checks covering format validation, forbidden phrases, and structural assertions should run on full traffic: broad coverage, low cost, no sampling decisions required. LLM-as-judge evaluations should run on a representative sample, scoring for correctness, groundedness, relevance, and safety. User feedback signals, including retry rate, negative reactions, and abandonment, function as real-time leading indicators of quality degradation that typically arrive before any automated metric catches the problem. Treating any one of these as complete coverage is how teams get surprised.
Distributed tracing has to capture the full reasoning chain: prompts, retrieval steps, tool calls, model handoffs, and evaluation results in sequence. Token-level accounting has to be separated from request-count metrics. KV cache and time-to-first-token instrumentation belong alongside GPU utilization in the infrastructure telemetry, not added later as an afterthought when latency gets weird.
A useful operational taxonomy separates three concerns that most teams collapse into one: operational metrics (latency, throughput, availability), economic metrics (token costs, prompt efficiency), and quality metrics (accuracy, safety, output drift). Each requires different instruments. Treating them as a single monitoring problem produces a monitoring strategy that addresses none of them adequately. Based on the current state of most production deployments, that description is more rule than exception.
For agentic systems, observability extends into governance. What actions did the agent take, under what authorization, and can that decision path be reconstructed after the fact? Oso, a fine-grained authorization platform that has extended into AI-agent authorization and governance, has framed the stakes directly: agents inherit human-scale access and operate at machine speed, which makes audit logs of every action and real-time detection of policy violations part of the instrumentation problem, not a separate workstream downstream of it.
The OpenTelemetry GenAI SIG, formed in April 2024, represents the industry's movement toward standardized semantic conventions for LLM telemetry. The standards are still maturing. The production systems they are meant to cover are not waiting. The question for most organizations is whether their internal monitoring approach is moving at the same speed as the deployments they are trying to observe, and the numbers suggest most are falling behind.