Telemetry Pipeline Design for AI Agent Observability
Agents fail invisibly, so observability must capture semantics, not just infrastructure metrics.
Traditional observability was built around a clean, satisfying question: did the request complete, and did it complete correctly? Status codes, latency percentiles, exception traces. The infrastructure assumption was that a service either works or it doesn't, and the failure modes are legible from structure alone.
Agents break that assumption immediately. An agent can return HTTP 200, throw no exceptions, complete within SLA, and still produce a harmful, incorrect, or policy-violating output. The infrastructure saw a success. The compliance officer saw something else entirely. This is the graceful failure problem, and it is endemic to agentic systems because their failure modes live in semantics, not structure.
A single user prompt to a ReAct-style agent can trigger a dozen internal tool invocations, several vector database queries, intermediate self-reflection steps, and multiple LLM calls before producing output. These loops do not map to linear call graphs. In a conventional distributed trace, they appear as a latency spike with no internal structure: a black hole that absorbed time and returned a result, with nothing in between that a span can explain. I have spent more hours than I care to admit staring at traces that look perfectly healthy by every structural metric while the actual behavior they represent was somewhere between "wrong" and "genuinely alarming."
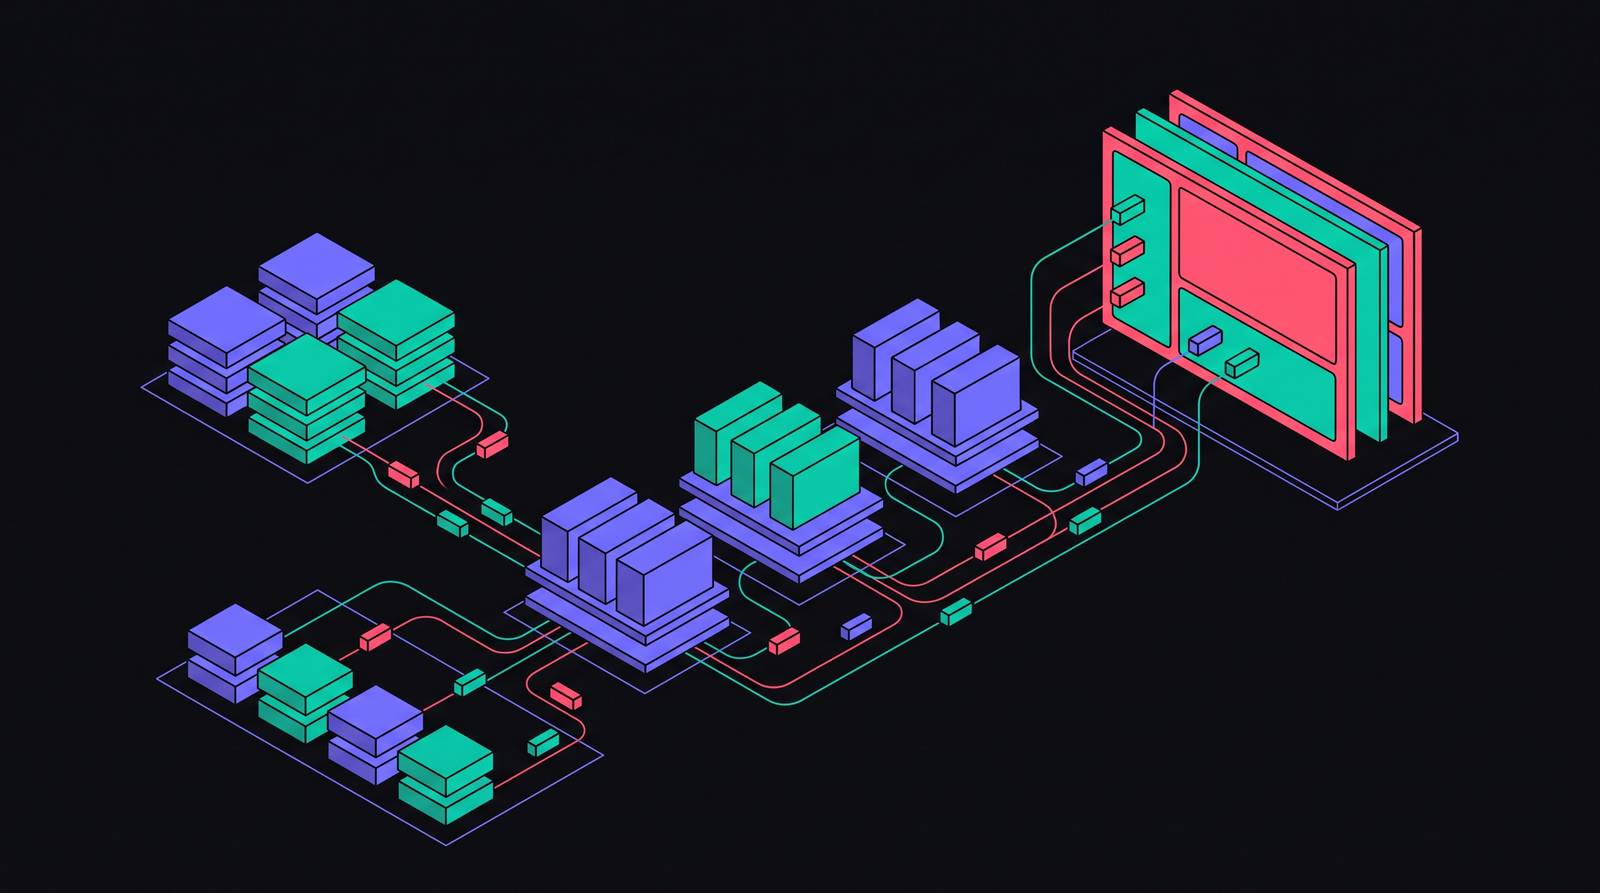
When instrumented correctly, agents emit five distinct signal types, each with meaningfully different pipeline requirements. LLM spans carry model name, prompt content or a content hash, completion content, token counts, latency, and finish reason. These are the atomic unit of LLM observability; without them, cost attribution is guesswork, full stop. Tool call spans record tool name, input arguments, return value or error, and duration. This is where the agent's effect on the world lives. From an enforcement perspective, tool calls are the most consequential signal type in the pipeline, and they are often the least carefully instrumented. Agent and orchestration spans capture planning steps, loop iterations, and handoffs between sub-agents. This is where you distinguish an agent thinking from an agent doing, which turns out to be a more important distinction than it sounds when you're trying to explain to a stakeholder why a workflow took forty seconds and cost three dollars. Policy and decision events are structurally distinct from logs: a log records that something happened, a policy event records which rule was evaluated, what the decision was, and whether a constraint fired. Behavioral anomaly signals are the most sophisticated category. They require comparison against a baseline rather than point-in-time capture, which means they cannot be generated at the application layer alone.
The right frame for evaluating agent health is not whether services are up. It is whether agents complete tasks correctly, at what cost, and within what constraints. The distinction between "infrastructure telemetry" and "agent quality telemetry" is an artifact of how teams are organized, not how agents actually work.
There is also a feedback dimension that conventional observability never had to accommodate. Agent traces feed evaluation tooling, which scores outputs for correctness, grounding, and safety. The pipeline is not just a record of what happened; it is an active input to improvement, and that changes what the pipeline must be capable of at a fairly fundamental level.
Multi-agent architectures sharpen every one of these requirements. The majority of enterprise AI projects now involve multiple agents coordinating across process boundaries. When a single user action fans out across agents that never share a process, trace context propagation across those boundaries is not optional. It is the difference between observability and an expensive collection of disconnected logs.
The Volume and Cost Problem That Pipeline Design Must Solve Before Anything Else
Here is the number that reorients every architectural conversation: a typical RAG pipeline generates somewhere between ten and fifty times more telemetry than an equivalent traditional API call. Broadly agentic workloads push that multiplier to one hundred. Every team I've watched skip this reckoning and jump straight to routing strategies or semantic conventions has eventually circled back to it, usually after a billing surprise that produces an uncomfortable all-hands.
Several cost axes inflate simultaneously in ways that compound each other. Active metric series grow because GPU metrics are dense and LLM-specific labels, including model name, quantization level, and adapter version, multiply cardinality with each new dimension. Log volume explodes because full prompt and completion logging turns each request into kilobytes or, for long contexts, megabytes. Trace span counts increase because agentic requests generate far more spans than traditional service-to-service calls.
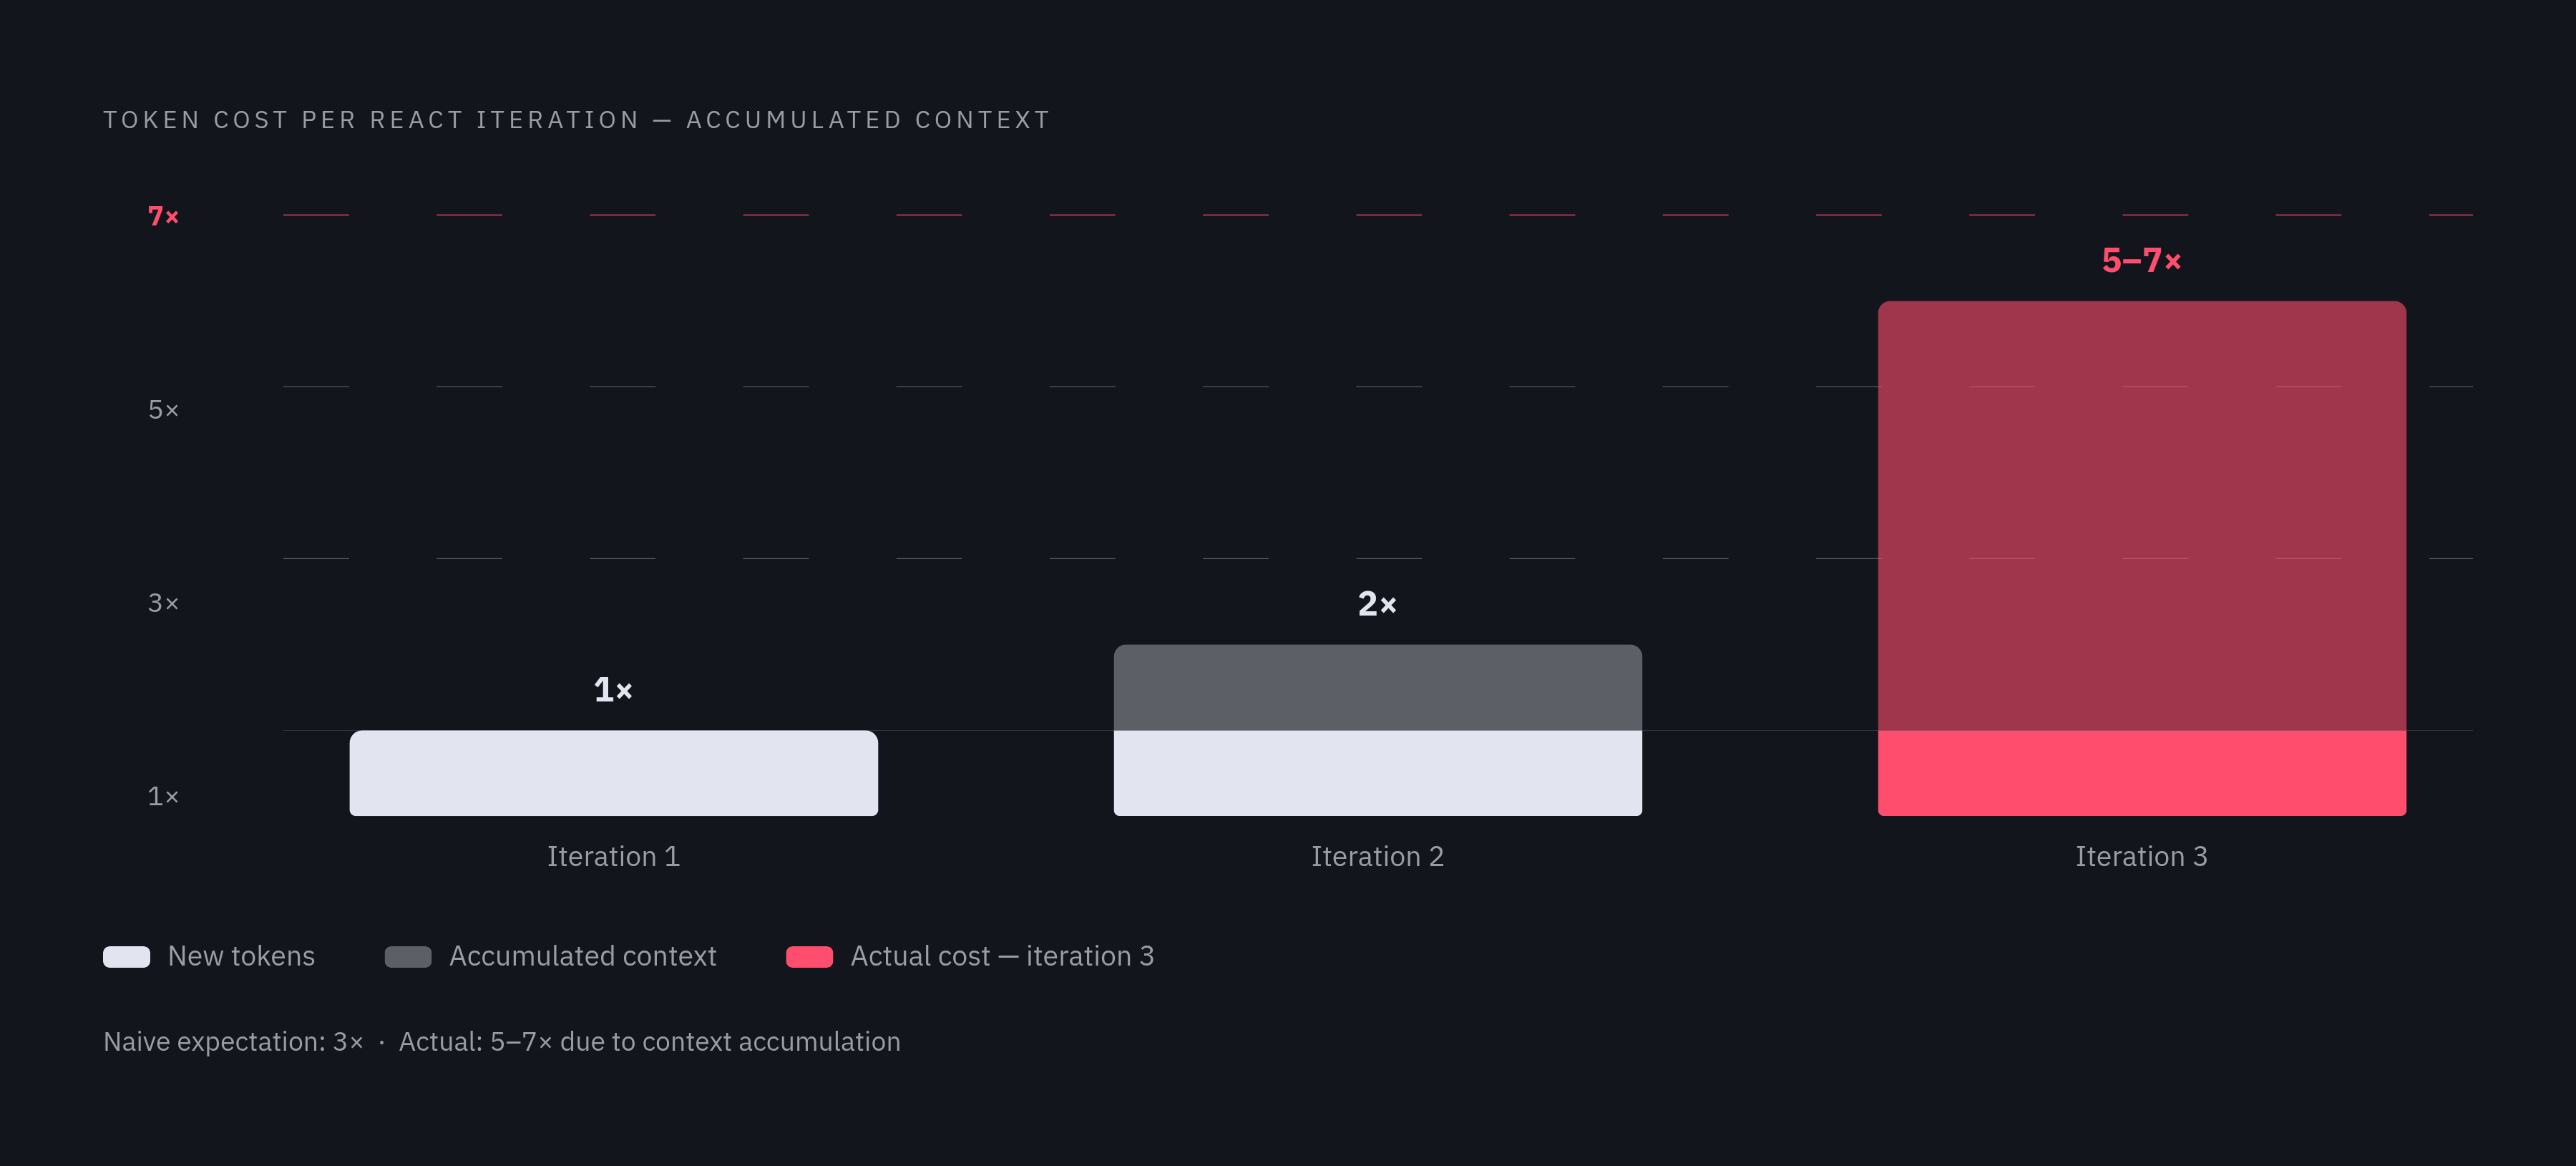
The token cost problem is non-linear in ways that reliably catch experienced teams off guard. A three-iteration Think→Act→Observe loop in a ReAct agent does not send three times the base tokens. It sends five to seven times, because each iteration accumulates context from prior iterations. Token costs compound. The pipeline must account for that compounding when estimating cost per request, and the estimate will still probably be lower than reality until you've run it in production for a few weeks.
Framework overhead is invisible in application code and omnipresent in telemetry. LangChain, LlamaIndex, and comparable orchestration frameworks inject system prompts and parsing instructions that add hundreds of tokens per call. Those tokens appear in telemetry whether or not any engineer anticipated them during cost planning. The gap between what the application developer thinks a call costs and what the billing meter sees is often substantial, and the meter is not wrong.
Per Grafana's 2025 Observability Survey, 74% of practitioners cited cost as a top priority in observability tooling decisions. Observability was once sold on capability; it is now evaluated on economics. The pipeline is where cost is controlled, before data hits a billing meter.
There is also a compounding trap specific to agent evaluation: observing and scoring agent behavior can consume nearly as many tokens as running the agent itself, per Splunk's analysis of AI tokenomics. Teams that instrument aggressively and evaluate comprehensively can double their token spend without generating a single additional user interaction. Treating cost optimization as a post-launch concern is how teams discover, painfully, that their observability bill exceeds their inference bill.
Core Pipeline Architecture: How to Route, Tier, and Sample Agent Telemetry
The foundational principle is deceptively simple: process, enrich, and govern telemetry before it reaches a storage platform. Pipelines that ingest everything indiscriminately and filter afterward pay for signals they never use.
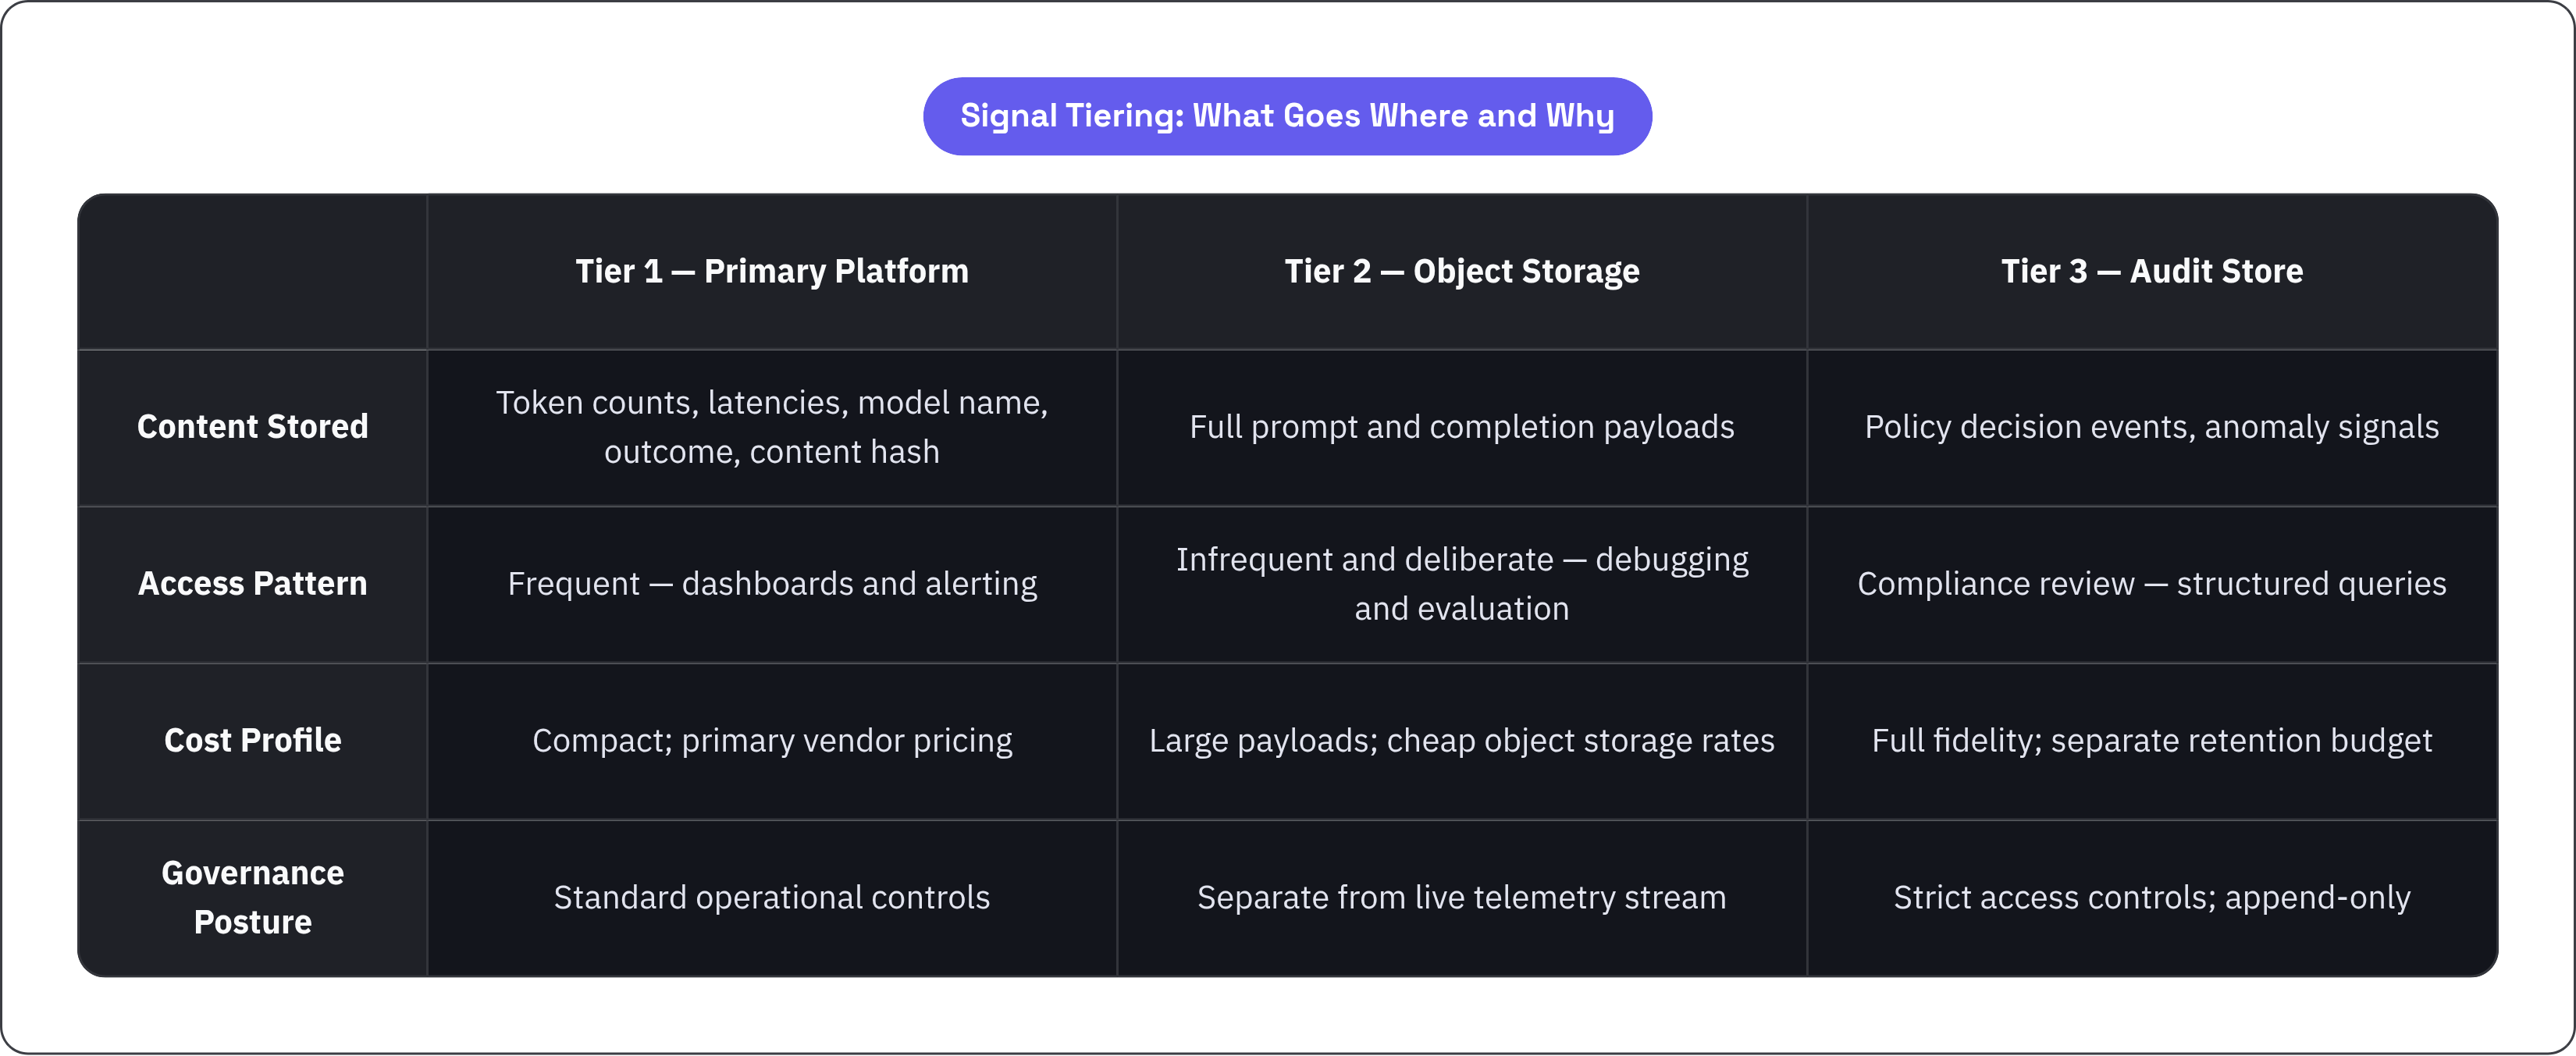
Signal tiering is the most consequential structural decision, and it follows naturally from recognizing that different signal types have different value densities, query patterns, and retention requirements. Tier 1 sends lightweight metadata to the primary logging or metrics vendor: token counts, latencies, model name, outcome, a content hash. This is everything needed for dashboards and alerting, compact and appropriately priced. Tier 2 routes full prompt and completion payloads to cheap object storage or a dedicated evaluation store, retained for debugging and evaluation without paying premium per-gigabyte rates to a primary observability vendor. The payloads are large; the access pattern is infrequent and deliberate. Tier 3 sends policy decision events and anomaly signals to a dedicated enforcement or audit store, with different retention periods, stricter access controls, and query patterns oriented toward compliance review rather than operational monitoring. Mixing them with operational telemetry is a governance antipattern that looks harmless until an auditor asks a question you cannot answer cleanly.
Cardinality control is one of the most reliable sources of unexpected cost in metric-based observability. High-cardinality labels, specifically request IDs, user IDs, and prompt IDs attached directly to metrics, create a new active time series for every distinct value. In an agent workload generating thousands of requests per minute, this is how metric costs spiral past any reasonable projection. Per-request identity belongs in traces, linked to metrics via exemplars. It does not belong in metric labels. Predictable cardinality is a pipeline responsibility; backends should not be asked to absorb what should have been controlled upstream.
Sampling strategy for agent workloads requires tail-based sampling, not head-based. Head-based sampling makes the keep-or-drop decision at the start of a request, before any of the interesting behavior has occurred. For agent workloads, you cannot know whether a trace is worth retaining until you have seen the full run: whether it contained a policy violation, a tool failure, an anomaly, an unexpected loop count. Tail-based sampling makes the decision after the full lifecycle is visible. Always retain traces containing policy decisions or anomaly signals regardless of the sampling rate applied to routine runs.
In-flight enrichment is where raw spans become auditable records. Agent identity, session context, policy version, and environment tags should be attached at the collector layer, not reconstructed during query time. Derived signals, including cost estimates, token budget utilization, and tool call depth, should be computed in the pipeline so that dashboards and enforcement rules can act on them immediately. Requiring these computations at query time adds latency, cost, and operational fragility to every downstream consumer.
Apica's 2025 analysis found that pipeline-first approaches can achieve up to 40% lower TCO compared to legacy observability platforms that ingest before filtering.
Vendor lock-in risk is the final architectural consideration, and one that teams consistently underweight until it becomes expensive to address. Pipelines that route directly to a single proprietary platform embed that platform's schema in every instrumentation decision. A vendor-neutral collector layer, which OpenTelemetry makes straightforward, preserves the ability to add or swap destinations without touching application code.
OpenTelemetry GenAI Semantic Conventions as the Instrumentation Foundation
The industry has converged on OpenTelemetry as the standard telemetry layer for AI systems. The GenAI Semantic Conventions SIG, active since April 2024, defines attribute schemas for LLM calls, agent invocations, tool executions, and session-level metrics. As of early 2026, the conventions standardize LLM client spans, agent spans, events for capturing prompt and completion content, and a set of metrics with specific attribute names, span kinds, and event structures for generative AI. This is the rare case where standardization arrived before fragmentation became completely unmanageable, which is not how this usually goes.
Before this standard existed, every observability vendor invented its own schema. Fragmentation made cross-vendor correlation impossible and pipeline routing brittle. A rule written to catch tool call spans from one framework broke silently when the team introduced a second framework with different attribute names. I have seen this exact failure mode more times than I would like. The conventions eliminate that problem, at least for compliant implementations.
Framework support has reached meaningful coverage. Datadog, Honeycomb, and New Relic support the conventions on the consumption side. LangChain, CrewAI, AutoGen, LangGraph, and AG2 emit OTel-compliant spans natively or via instrumentation packages. The ecosystem is not yet universal, but sufficiently broad that teams building on major frameworks can adopt the conventions without fighting their toolchain.
Two instrumentation models exist with genuinely different trade-offs. The built-in model, exemplified by CrewAI's approach, makes observability native to the framework. Spans emit convention-compliant attributes by default, requiring no additional configuration. The trade-off is framework coupling: you get simple, correct instrumentation because you accepted the framework's model of what an agent is. The contrib-library model allows teams to mix instrumentation packages for their cloud provider, LLM vendor, and agent framework independently. More flexible, and when done carefully, more likely to follow best practices consistently. The risk is fragmentation: packages that fall out of sync can produce inconsistent attribute names or missing spans, reintroducing the very problem the conventions were designed to solve. Both models work; neither is free.
One gap in the conventions deserves explicit acknowledgment, because teams that assume OTel covers everything will build pipelines that have observability without control. The conventions standardize how to capture model attributes, token usage, and latency. They do not cover output evaluation, safety scoring, or policy compliance assessment. OTel is the data plane. A purpose-built evaluation and enforcement layer must sit alongside it, scoring outputs for faithfulness, toxicity, and policy adherence. A pipeline that terminates at OTel collection knows what the agent did but has no mechanism to assess whether it should have.
The practical payoff for pipeline design is real. When every span uses the same attribute names, routing rules become stable across framework versions and vendor changes. A rule stating "route all spans where gen_ai.tool.name is present to the audit store" does not need to be rewritten when the framework version changes. In a landscape where the agent framework ecosystem is still evolving at an uncomfortable pace, that stability is worth more than it sounds.
Where Real-Time Enforcement Fits in the Pipeline and Why Post-Hoc Review Is Insufficient
The temporal argument is not subtle. Agents act at machine speed with human-scale access to systems and data. An agent that inherits a user's permissions and executes tool calls autonomously can propagate a violation across multiple systems before any human reviewer has had time to open a dashboard. Post-hoc review produces forensic records. It does not produce control.
Every enterprise AI team I've spoken with recently has agents running in production, most operating on access models designed for human users, not for software that executes continuously and autonomously at scale. The pipeline is where the mismatch between human-oriented access models and machine-speed execution is first visible and first correctable.
Real-time enforcement requires several specific capabilities working together. Policy decisions must be evaluated on the span or event stream as it moves through the pipeline, not after it lands in storage; this requires the pipeline to be stateful in the relevant dimensions, carrying enough context about current session state to evaluate rules against. Tool call spans are the correct enforcement attachment point because the pipeline can evaluate a tool invocation against policy before acknowledging it as complete. If the call violates a rule, the pipeline can flag it, route it to a quarantine destination, or signal the agent runtime to halt execution. This is categorically different from logging the violation after the tool has already acted, and the difference matters enormously in practice. Anomaly detection on behavioral signals, including unexpected tool sequences, token budget overruns, and repeated self-invocation patterns, requires comparing the current span against session context, which is only possible if the pipeline has performed enrichment at ingestion.
Audit log integrity is a distinct requirement that must be accommodated separately from operational telemetry. Compliance-grade audit trails need tamper-evident, append-only storage at full fidelity. This is not the storage model for operational telemetry, which is routinely sampled, summarized, and aged out. Mixing these concerns in a unified storage tier is a compliance risk that manifests quietly until it matters urgently.
A pipeline that records what an agent did produces a forensic record. A pipeline that evaluates agent behavior against policy in flight produces control. Both are necessary. They do not share the same architecture, and pretending otherwise is a choice that becomes someone else's incident to explain.
Multi-Agent Architectures and the Trace Correlation Problem
The single-agent instrumentation model is already a minority case in enterprise production. Fewer than a quarter of enterprise AI projects involved multi-agent systems a couple of years ago; that figure has since climbed to nearly three-quarters. Any pipeline architecture that does not account for distributed agent coordination is already behind actual deployment reality.
The core technical problem is precise and unforgiving. When Agent A delegates to Agent B, which calls Agent C, and each runs in a separate process or service, trace context must propagate across every single boundary or the runs appear as disconnected spans with no causal link. W3C Trace Context propagation must be threaded through every agent-to-agent call, every tool invocation that crosses a service boundary, and every message queue or asynchronous handoff. The pipeline cannot reconstruct what was not propagated. There is no post-hoc remedy for missing trace context.
Failure to propagate context is, in practice, the most common reason multi-agent traces appear fragmented. It is rarely a deliberate architectural choice. It is the accumulated result of handoff code written without awareness of the tracing requirement, async message passing that drops headers, and framework integrations that do not thread context by default. The fix is upstream, in instrumentation, but the symptom is visible in the pipeline as disconnected traces that cannot be stitched together after the fact.
Session and conversation IDs form a higher-level correlation layer that is distinct from trace propagation and equally necessary. Individual traces capture one run. Session context links runs across turns, agents, and time. Without it, understanding an agent's behavior over a multi-turn workflow requires reconstructing the sequence manually from disconnected traces, which is the kind of work that makes engineers quietly question their career choices.
Several pipeline implications are specific to multi-agent architectures. The collector layer must accept spans from heterogeneous sources, meaning different frameworks, different languages, and different cloud environments, and stitch them under a shared trace ID. Fan-out detection is a pipeline-layer responsibility: when one user action spawns a large number of downstream agent invocations, that pattern should surface as a signal in its own right, with both cost visibility and anomaly detection implications. Attribution in violation scenarios is significantly more complex in multi-agent systems; a policy violation must be attributable to the specific agent and specific tool call that triggered it, not merely to the originating user request. The orchestrator-versus-executor distinction matters for routing policy decisions correctly, and a pipeline that treats all spans identically will misattribute violations and misroute policy events.
What a Production-Ready Agent Telemetry Pipeline Looks Like End to End
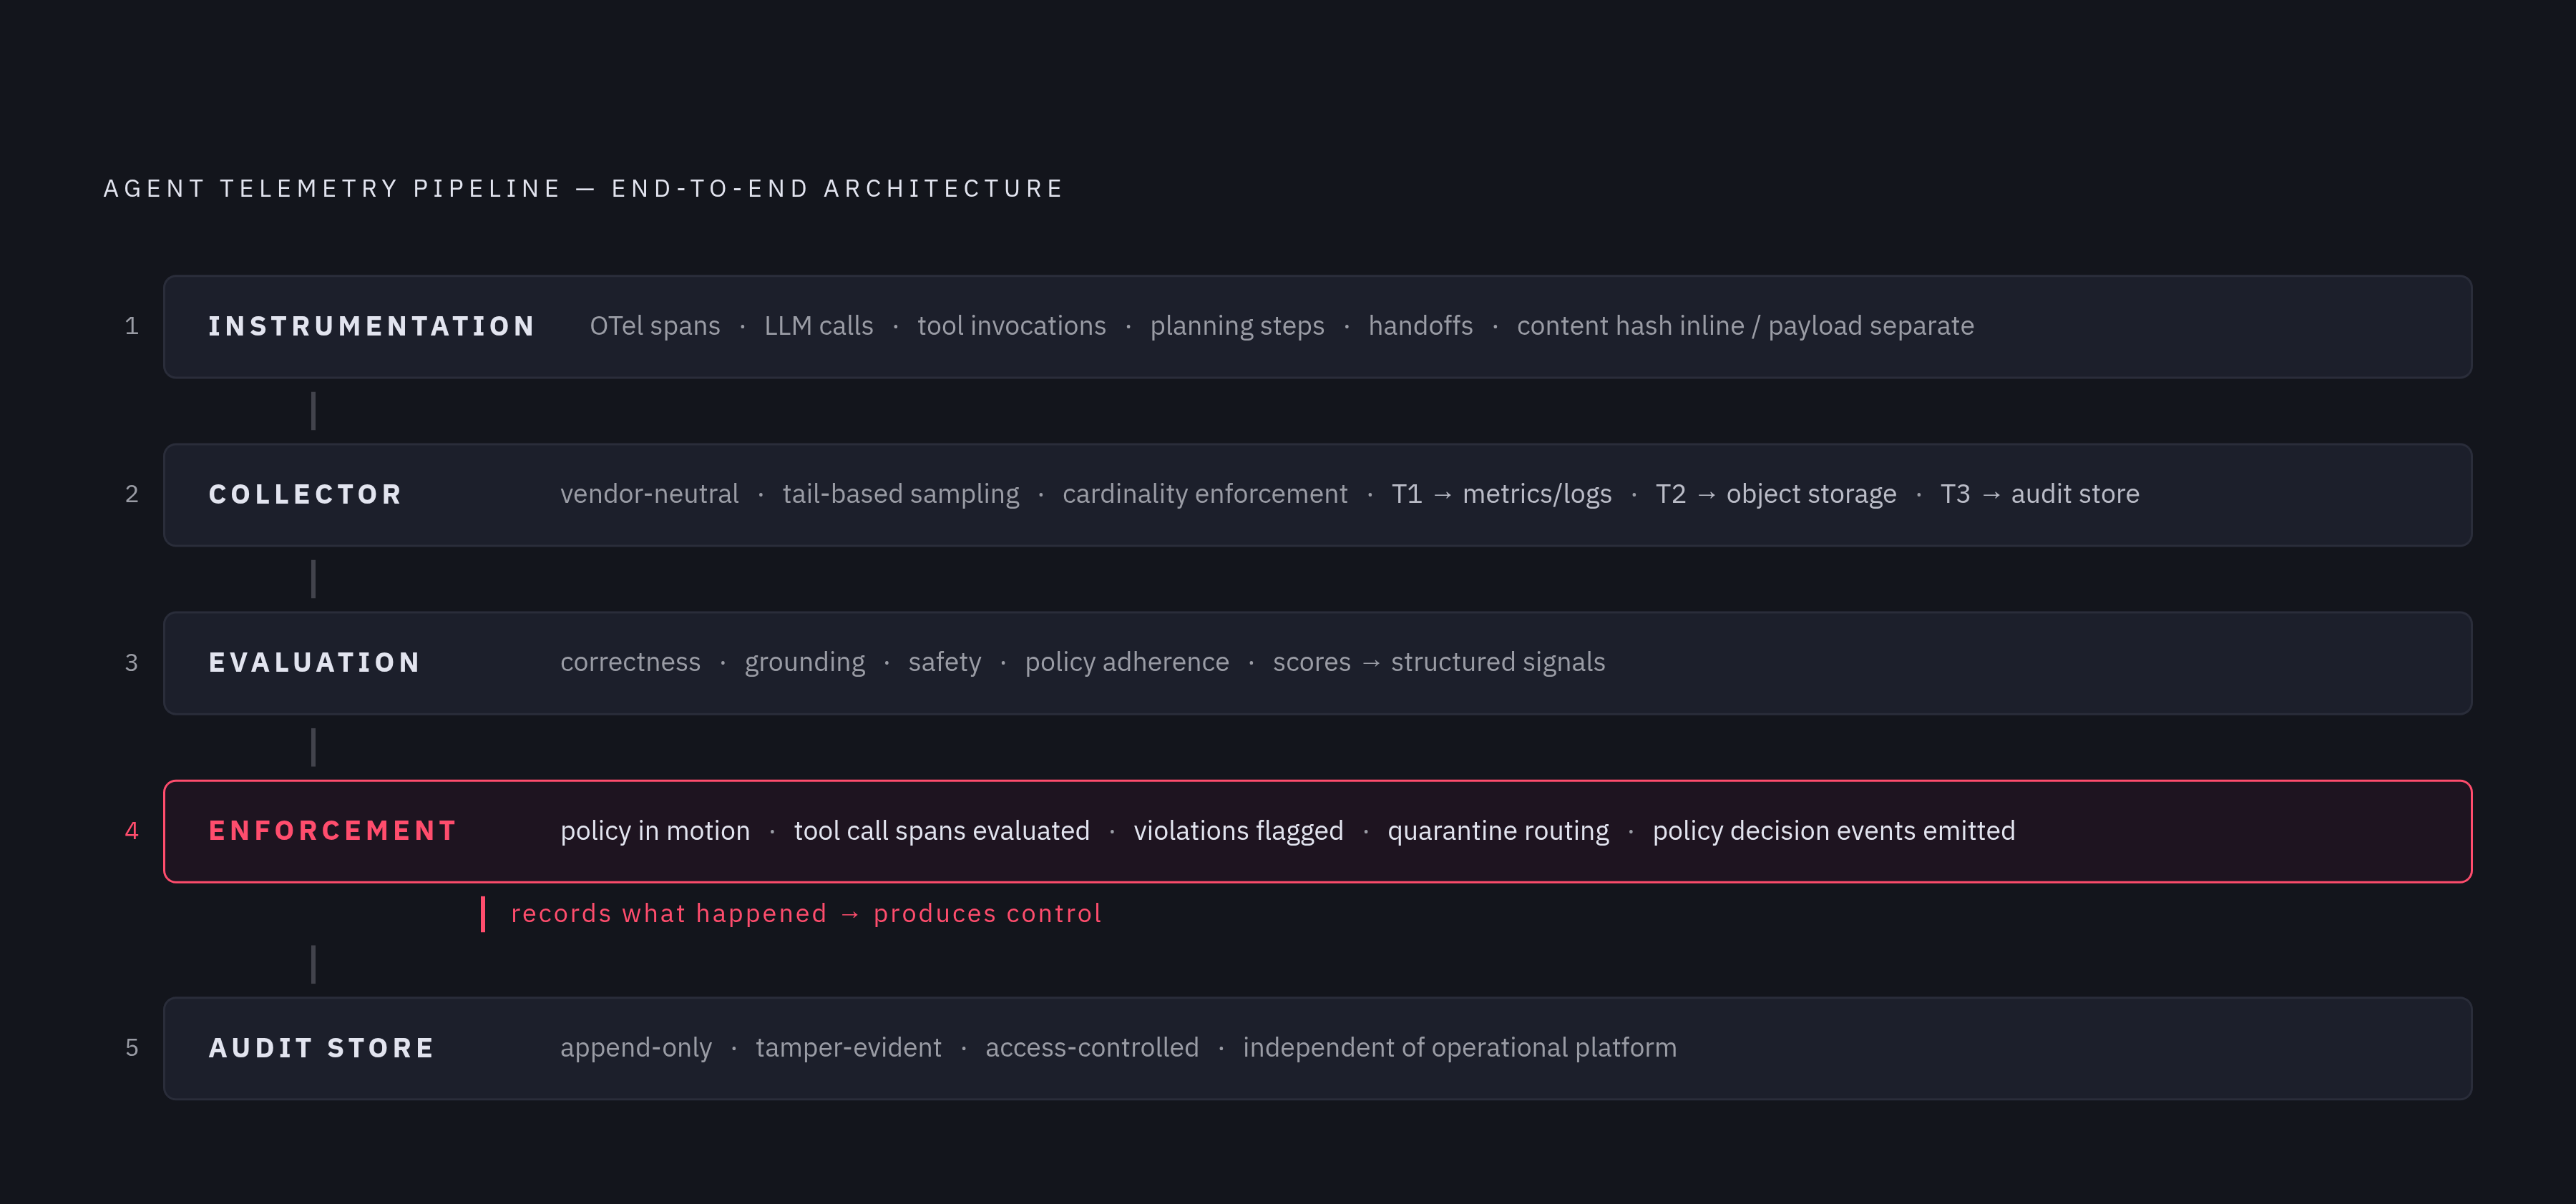
A production-ready agent telemetry pipeline is not a single tool or a single product category. It is a composed architecture, and the composition decisions matter as much as any individual component choice. Teams that treat it otherwise tend to find out why around the time their first real compliance question arrives.
The instrumentation layer emits OTel-compliant spans for every LLM call, every tool invocation, every planning step, and every agent handoff. It attaches session IDs and conversation IDs at the point of generation. It uses semantic conventions for attribute naming so that downstream routing rules are stable and portable. It does not log full prompt and completion content inline to the primary logging stream; it emits a content hash inline and routes the full payload separately.
The collector layer is vendor-neutral, operating as the pipeline's central processing stage. It performs tail-based sampling decisions only after a full trace is assembled, enriches spans with derived signals before any signal reaches a storage destination, enforces cardinality discipline, and applies tiering rules: lightweight metadata to the primary metrics and logging platform, full content payloads to object storage, policy events to the audit store.
The evaluation layer sits alongside the collection pipeline, not downstream of it. Agent traces flow into evaluation tooling that scores outputs for correctness, grounding, safety, and policy adherence. Evaluation results feed back into the pipeline as structured signals, annotating traces with quality scores that downstream consumers can query.
The enforcement layer operates on the span stream in motion. It evaluates tool call spans against policy rules before acknowledging completion, runs anomaly detection against behavioral signals enriched with session context, routes violations to a quarantine destination, and generates structured policy decision events that land in the audit store at full fidelity, outside the scope of the operational sampling strategy.
The audit store is append-only, tamper-evident, and governed by access controls distinct from the operational telemetry platform. It retains policy decision events and tool call records touching sensitive resources for the retention period required by applicable compliance frameworks. It is queryable by compliance and security teams independently of the operational observability platform.
Teams that treat agent telemetry as an extension of existing application observability, incrementally adding agent-specific dashboards to an existing platform, consistently discover the same things: the volume economics are wrong, the signal types are missing, and the enforcement capabilities do not exist. The pipeline architecture described here requires deliberate design from the beginning. The alternative is an observability system that reports nominal status while the agent executes something inadvisable at a speed no human reviewer can intercept.