Agent Tracing Across Multi-Step Tool Calls
Structured spans across tool calls reveal where agents actually fail, not just that they failed.
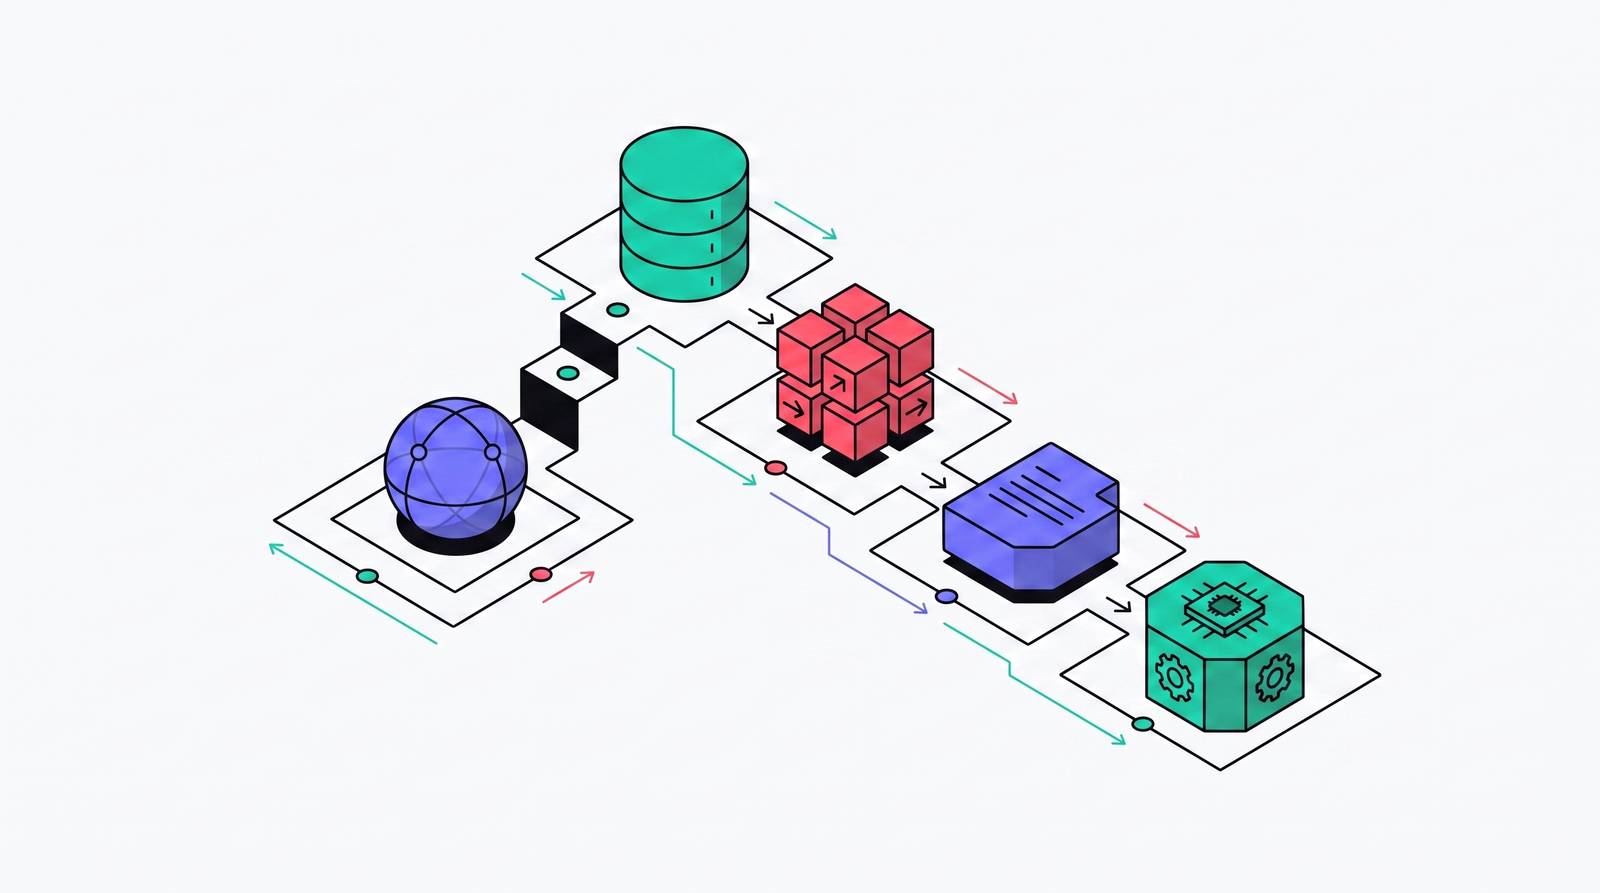
The core unit of an agent trace is the span: a discrete, timestamped record of one thing the agent did, nested under a parent trace representing the full run. Think of the parent trace as the case file and each span as an individual report filed inside it. What makes agent tracing different from logging a single LLM call is that the spans map directly to the ways agents actually fail, which means if you skip them, you are not just missing data; you are missing the right data.
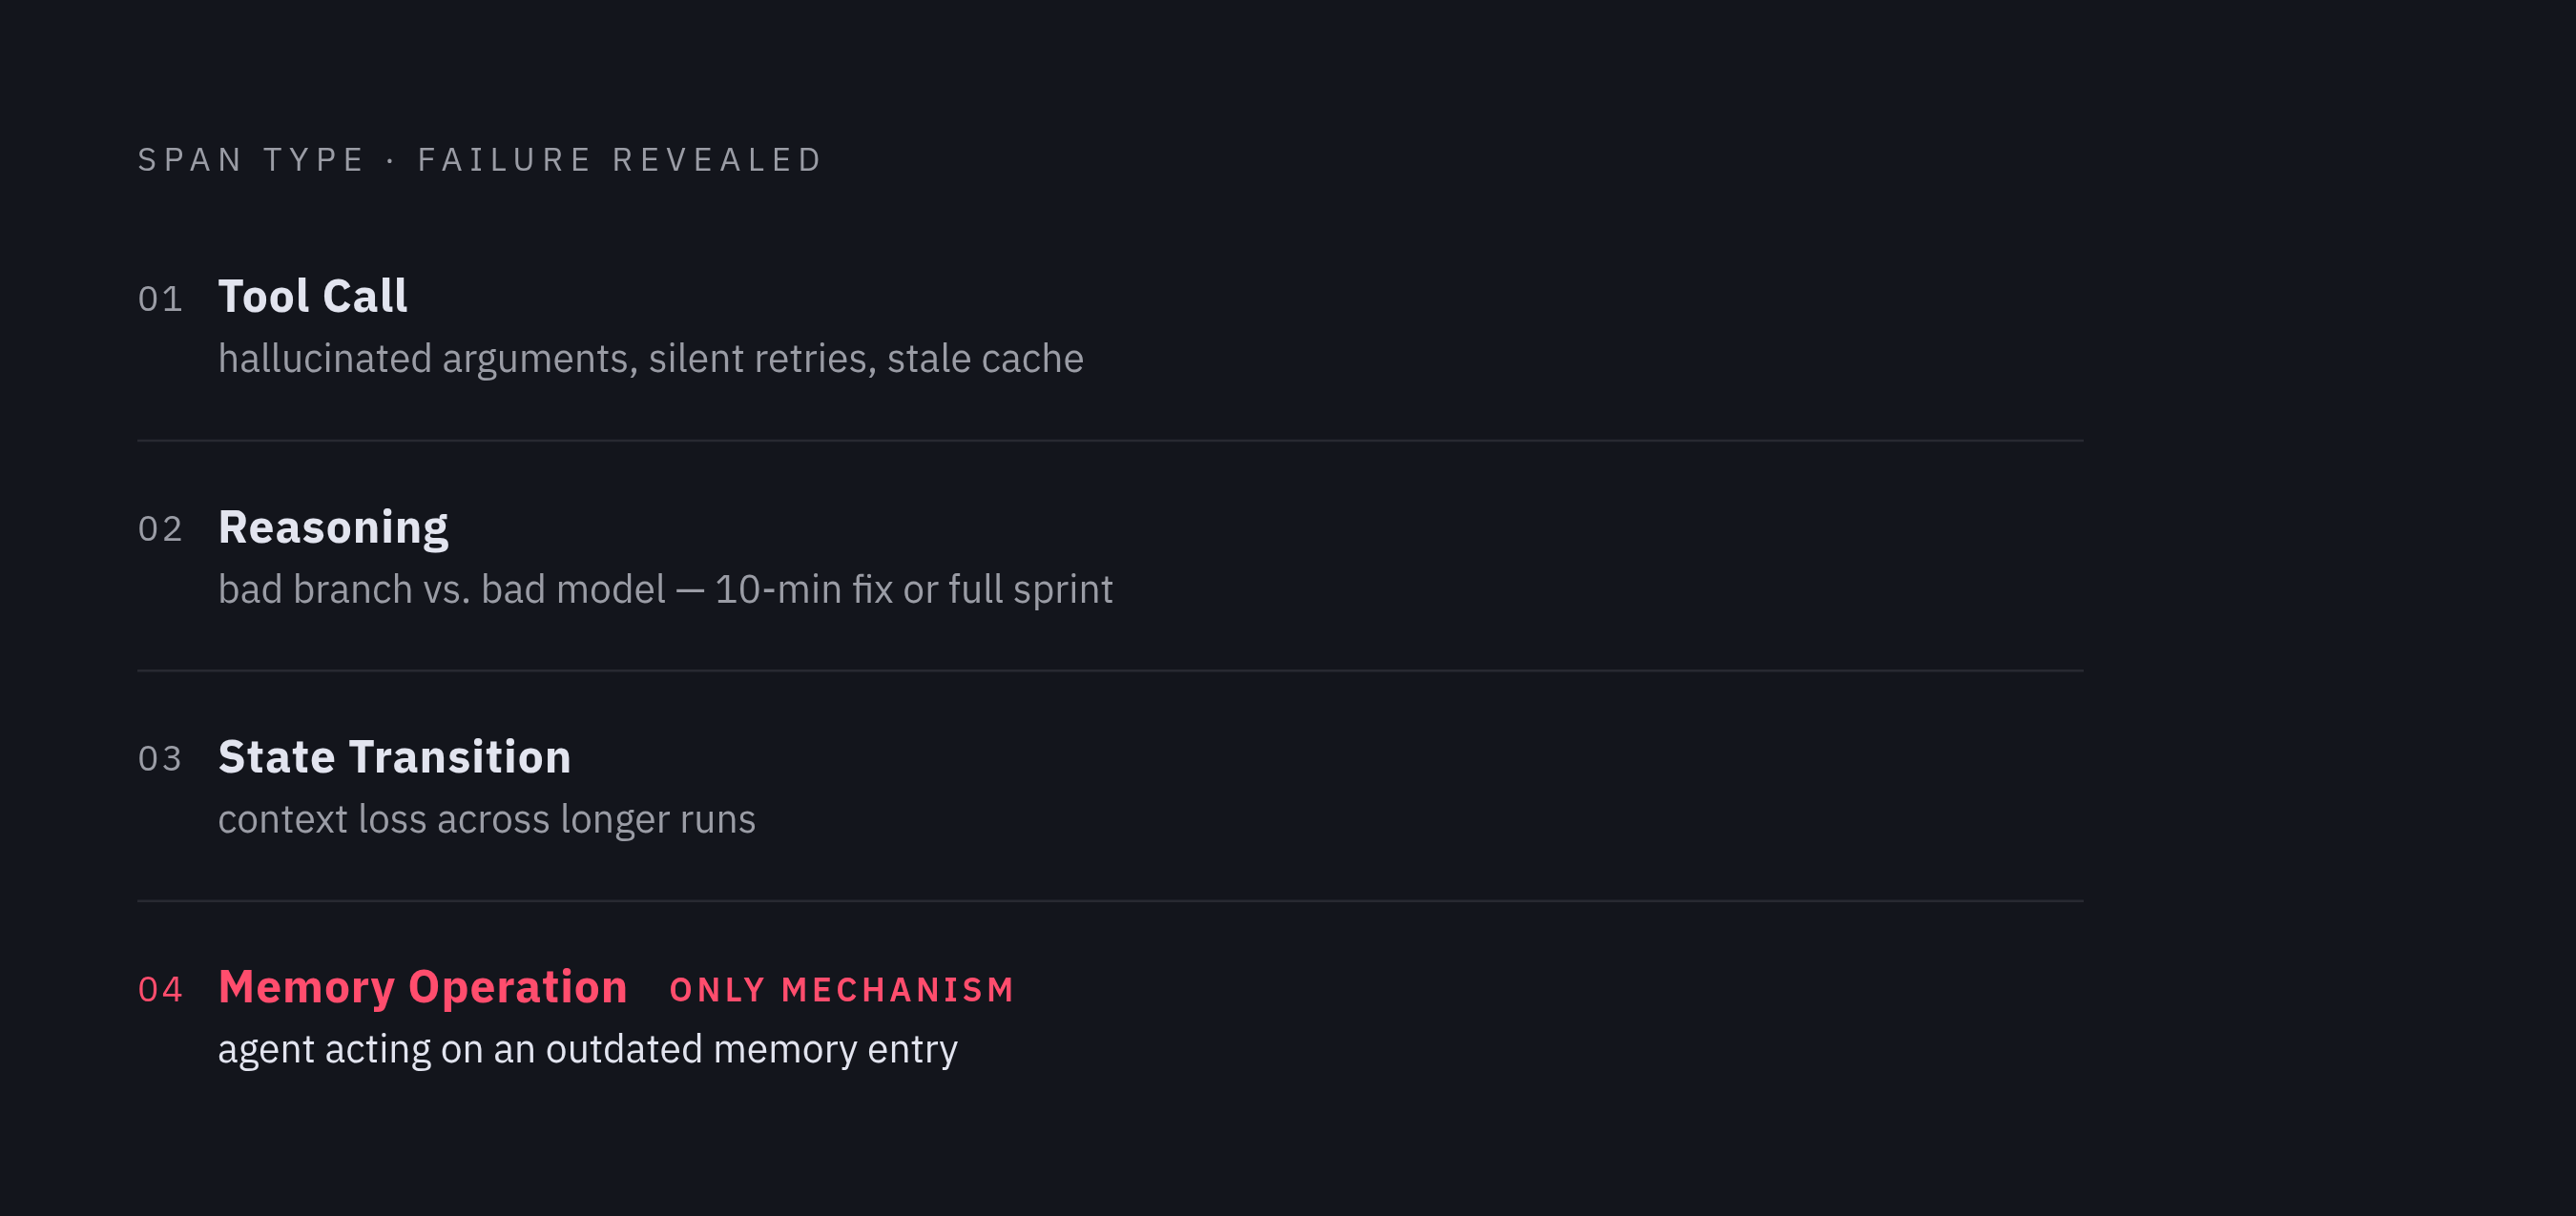
Four span types matter in practice. Tool call spans capture the tool name, structured arguments, raw output, duration, retry count, and error state. They are where hallucinated arguments surface, where silent retry loops become visible, and where a tool returning stale cached data stops being an invisible problem. Reasoning spans capture the model's plan, the action selected, the observation made, and the next decision. Without them, a bad branch looks indistinguishable from a bad model, which is a meaningful difference when one costs ten minutes and the other costs a sprint. State transition spans record what the context looked like before and after each step, including any handoff payloads, making context loss traceable across longer runs instead of just mysterious. Memory operation spans capture the retrieval query, the entries returned, and their relevance scores; this is the only mechanism that catches an agent acting on an outdated memory entry that was accurate when written and wrong when retrieved.
Every span should carry a minimum set of fields: span type identifier, trace ID, parent span ID, session ID, user or tenant ID, structured inputs, raw outputs, start and end timestamps, and a typed error state with retry count. These are not optional enrichment. They are the difference between a trace you can debug and a trace you can only stare at.
Parent-child nesting is what turns a list of spans into a readable execution tree. Each tool invocation sits under the LLM span that triggered it, preserving the reasoning-to-action-to-result chain structurally, not just chronologically. For agents running parallel tool calls, that structure becomes a directed acyclic graph rather than a linear chain. Instrumentation that flattens a DAG into a sequence loses the parallel structure entirely, so you cannot tell whether two tool calls ran concurrently or whether one caused the other. That distinction matters more than it sounds.
One scenario that burned several hours before the lesson landed: a tool silently returning cached data from a stale connection pool. The LLM was fine. The tool threw no errors. Every HTTP status was 200. The problem was completely invisible until tool executions were treated as first-class spans with their own duration, output, and retry fields. At that point the cache hit showed up as a span attribute, the staleness became auditable, and what had been an hours-long debugging session collapsed to minutes. The trace did not find the bug; it made the bug findable.
How OpenTelemetry's GenAI Conventions Are Standardizing the Span Vocabulary
Before a shared vocabulary existed, every framework invented its own span names and attribute keys. Traces from LangChain looked nothing like traces from AutoGen, and no backend could render both correctly without a custom parser. In April 2024, OpenTelemetry formed the GenAI Special Interest Group to fix this, defining span names, attribute keys, metric instruments, and event names that any GenAI instrumentation should emit.
The conventions cover six layers: model invocations, tool executions, agent runs, retrieval, memory operations, and content capture. That coverage maps almost exactly to the span types described above, which is a reasonable signal that the spec was designed by people who had actually debugged agents rather than just modeled them abstractly.
Four agent-specific span operation types are defined: createagent, invokeagent, invokeworkflow, and executetool. The span kind distinction carries practical weight. invoke_agent is a CLIENT span when the agent runs remotely, as with the OpenAI Assistants API or AWS Bedrock Agent, and an INTERNAL span when it runs in-process, as with LangChain or CrewAI. That distinction affects how distributed traces are assembled and how latency is attributed, two things that are easy to get wrong without it.
Key standardized attributes include genai.agent.id, genai.tool.name, genai.request.model, genai.usage.inputtokens, genai.usage.outputtokens, and genai.response.finish_reasons. These are what backends like Jaeger, Tempo, and Datadog use to render traces correctly without custom parsers. By Q1 2026, the major agent frameworks, including the OpenAI Agents SDK, LangChain, LlamaIndex, and AutoGen, had shipped emitters against this spec. Datadog announced native support for OTel GenAI conventions starting with v1.37, released December 1, 2025.
One honest caveat: as of mid-2026, the GenAI and MCP semantic conventions remain in Development status, with no public stabilization timeline. Teams adopting now should version-pin their instrumentation and budget for attribute name changes. That costs something. It is still better than every framework speaking a different dialect.
Connecting Traces Across MCP Tool Servers and Service Boundaries
Model Context Protocol became the dominant pattern for agents calling external tools in 2025. Created by Anthropic, open-sourced in November 2024, and subsequently governed under the Linux Foundation's Agentic AI Foundation, MCP solved a real integration problem and introduced a new one: the agent produces Trace A, the MCP server produces Trace B, and without explicit context propagation you have two disconnected fragments instead of a coherent execution tree.
The spec addresses this through W3C Trace Context propagation via SEP-414, which locks down the traceparent, tracestate, and baggage key names in the MCP meta field so distributed traces correlate across SDKs and gateways. A fully instrumented MCP trace tree looks like this: invokeagent for the research assistant at the top, nesting a chat span for the model call, which nests execute_tool for the first tool, which leads back to another chat span, and so on. Continuous and hierarchical rather than a pile of orphaned spans.
The openinference-instrumentation-mcp package is worth understanding precisely because its function is minimal by design. It emits no spans of its own. Its sole job is to propagate OTel context across the MCP wire protocol so that independently created spans join into a single trace. That restraint is the design.
Multi-service agents, where a supervisor delegates to specialized agent services, face the same problem at the service level. Spans only become one coherent trace if they share a trace ID. The practical solution is standard OTel context propagation combined with deterministic trace ID derivation from a seed such as an external request ID, so any downstream service can reconstruct the same trace ID without coordination overhead. This also means an evaluation pipeline running hours later can compute the same trace ID and attach its results to the original execution record, which turns out to be genuinely useful.
Anyone who tells you distributed agent tracing is a fully solved problem is selling something. The conventions are still in Development status, and cross-vendor MCP trace correlation depends on frameworks and gateways implementing the same draft spec consistently. The gaps are real and narrowing, in that order.
Where Multi-Step Tool Call Chains Actually Fail, and Why Traces Expose It
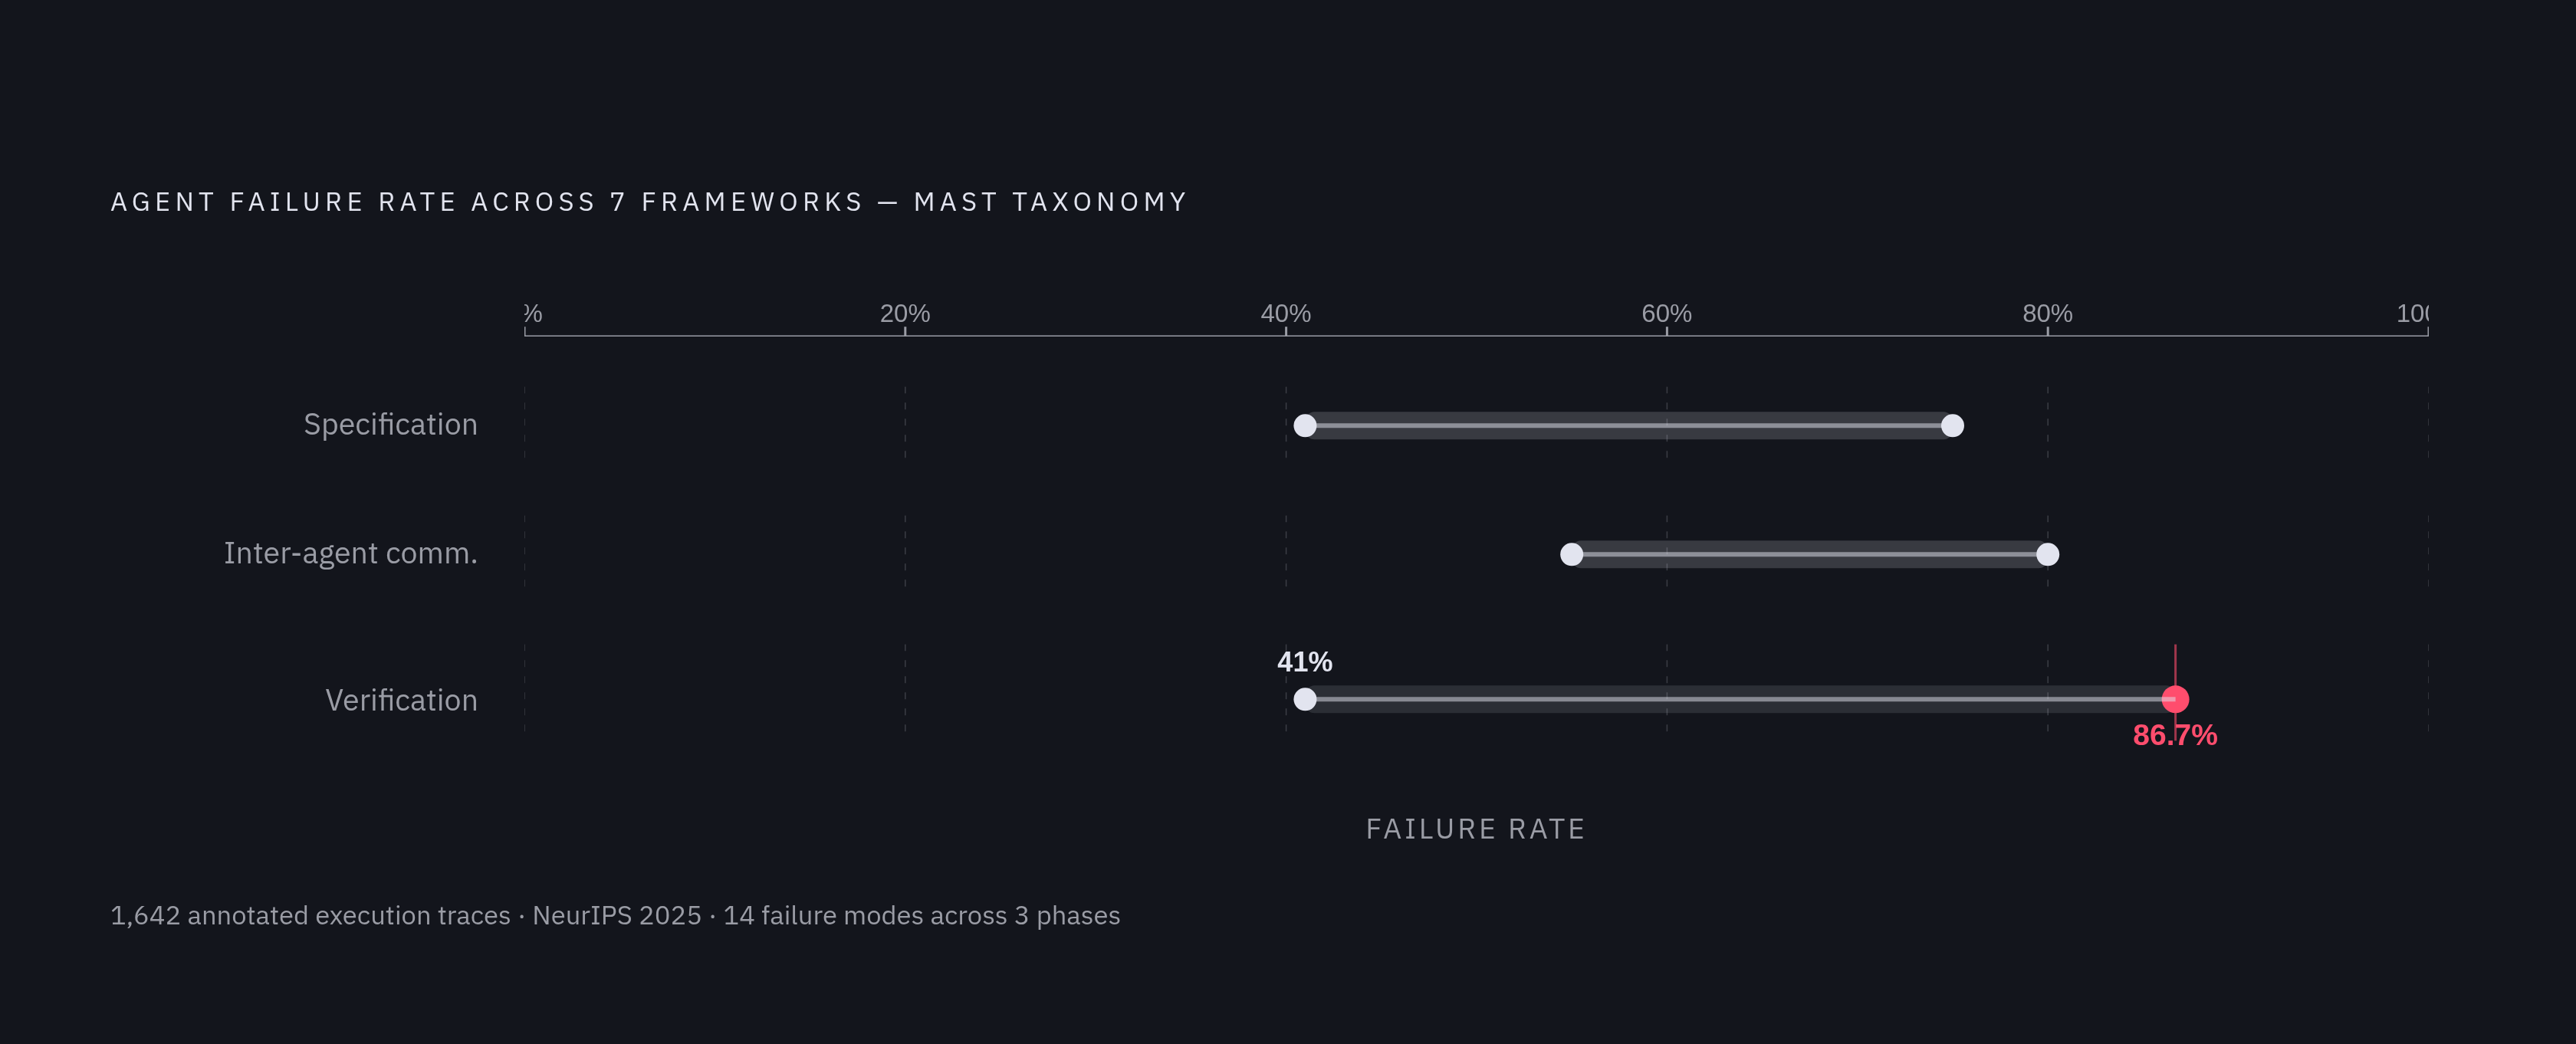
The MAST taxonomy, accepted at NeurIPS 2025, identified 14 distinct failure modes across three categories from 1,642 annotated execution traces across seven frameworks. Failure rates ranged from 41% to 86.7% depending on the framework. That range is, to put it charitably, not reassuring.
Failures distribute across specification, inter-agent communication, and verification phases, with no single category dominating. The practical implication: a monitoring strategy that covers only one phase has a false sense of coverage, because failures hide at every phase of the chain.
Cascading tool failures occur when one tool times out or returns a hallucinated output and the next agent in the chain receives that corrupted result as fact. No step throws an exception. The error propagates silently, accumulates authority with each subsequent reasoning step, and surfaces only in the final answer, which by then looks like a model quality problem rather than a tool failure two steps back. Coordination failures occur when one agent assumes another completed a handoff that actually failed silently; the incomplete workflow appears finished until something downstream breaks in a way that is difficult to trace to its origin. Plan drift is invisible without reasoning spans and systematically misattributed to model quality when those spans are absent. Stale memory reads are particularly insidious because the agent is behaving correctly given what it retrieved; the retrieval was simply wrong, and the only record of what was retrieved, with what query and what relevance scores, lives in the memory operation span.
Non-determinism compounds all of these. LLMs vary run-to-run, so the same inputs can produce different decisions across executions. A trace captures the specific execution that produced the failure, which is the only version that matters for debugging. A statistical summary across many runs cannot tell you which branch this particular run took.
The research finding that sticks is consistent with field experience: developers struggle to review long agent conversations, lack interactive debugging support, and need the full execution chain, not a summary, to locate root causes in multi-step failures. Better prompting does not fix this.
Instrumenting Agents in Practice: Three Integration Patterns and Their Tradeoffs
Three integration patterns exist, and the choice between them has consequences that show up later at the worst possible time.
Proxy-based instrumentation routes agent requests through an observability proxy. Setup requires no code changes and works quickly. The tradeoff is that it captures only LLM-level data. Custom tool calls and business logic remain invisible, which means the failure modes described above, specifically cascading tool failures and stale memory reads, are undetectable through this pattern alone. It is the right starting point for a proof of concept. For production agents where those failure modes occur at meaningful rates, it is not sufficient.
SDK instrumentation wraps LLM clients and tool functions with tracing instrumentation directly in code. More setup, but it produces the complete execution graph including custom spans for tool calls, memory operations, and business logic. This is the correct choice for any agent operating in production where debugging requires actual visibility. The instrumentation cost is a one-time investment; the debugging cost of skipping it recurs with every incident, which adds up faster than the setup would have.
Auto-instrumentation via OTel is the lowest-friction option when the framework supports it. MLflow automatically traces agent workflows and captures the full DAG including parallel tool calls, conditional branches, and iterative reasoning loops. Coverage depends entirely on what the framework chooses to emit, which means reviewing the framework's instrumentation scope before assuming completeness is not optional; it is the first thing to check.
Two operational considerations cut across all three patterns. Traces should be exported asynchronously so instrumentation adds no latency to agent responses; this is safe to enable in production at high-volume workloads. For cost, keeping every trace from a high-volume agent is expensive and mostly unnecessary. A practical approach is full retention for failures and for runs that are slow or costly, with downsampled retention for normal successes.
The PII and secrets problem is not academic. Tool arguments and model outputs regularly contain credentials, personal data, and sensitive business context. Redaction should happen before export, not after. Collector-side redaction processors like Microsoft Presidio running as a sidecar are a common and defensible pattern. The telemetry store itself becomes an attack surface as agents access more sensitive corporate data, and treating it accordingly is correct risk modeling, not overcaution.
What the Current Tooling Landscape Offers for Agent Tracing
Per LangChain's State of Agent Engineering report, a large majority of organizations have implemented some form of agent observability, with roughly three-fifths having detailed step-level tracing. Observability has become a baseline expectation, not an advanced practice. The tooling reflects that maturity, for better and for worse.
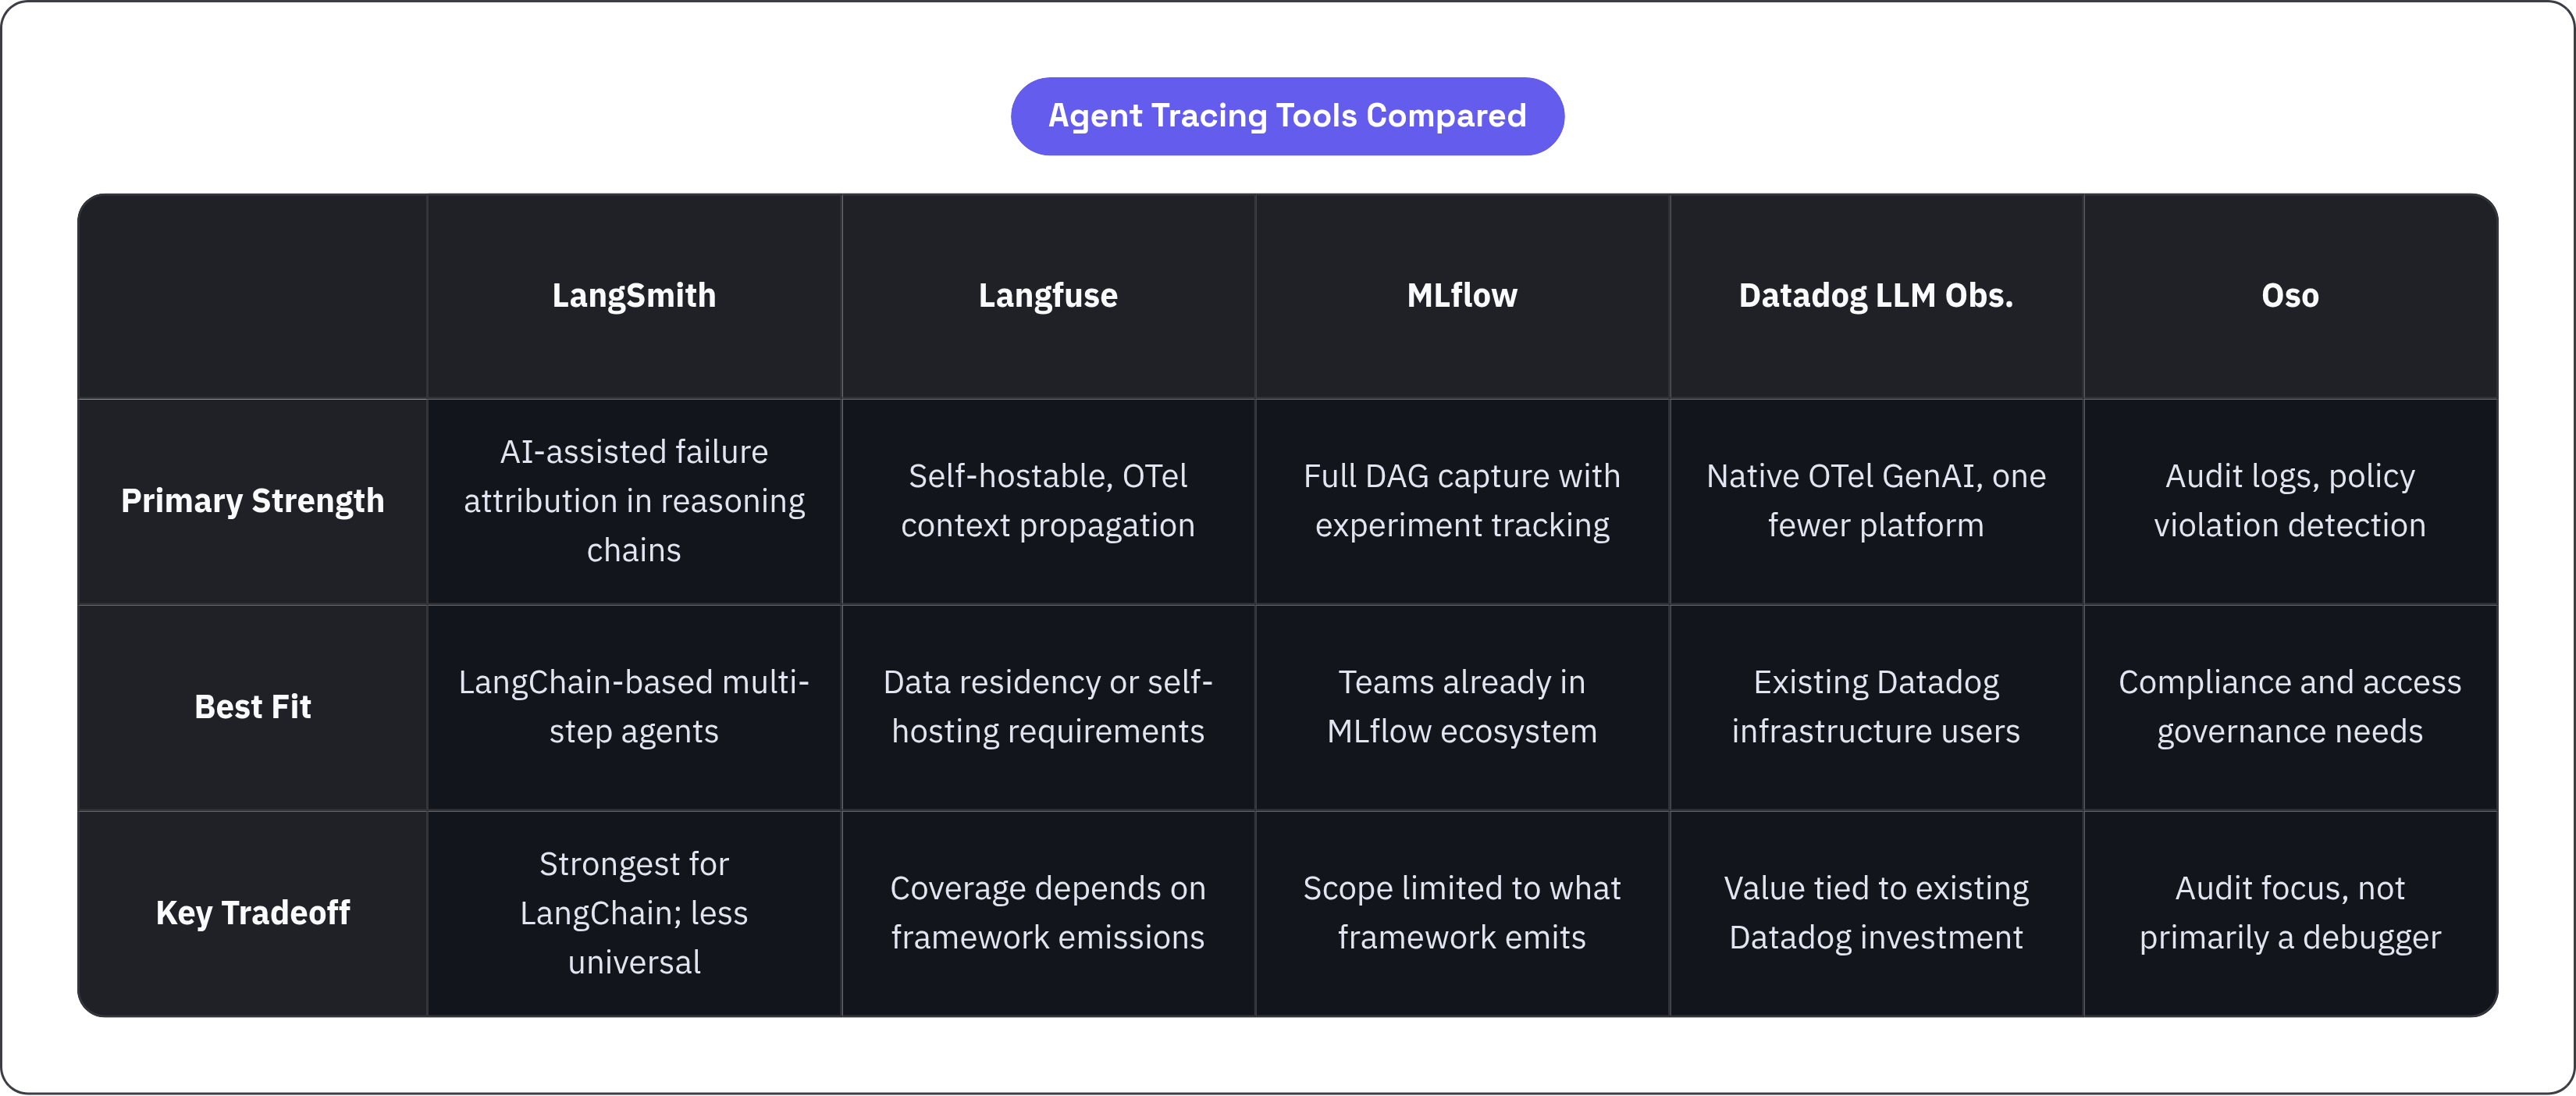
LangSmith shows the full execution tree, covering every LLM call, tool invocation, retrieval step, and the reasoning connecting them. For complex multi-step agents it uses AI to identify which specific decision, prompt instruction, or tool call caused a failure. It is the natural fit for LangChain-based agents and, more broadly, for teams whose primary debugging need is tracing reasoning chains through long agentic workflows.
Langfuse supports distributed tracing through trace ID propagation across service boundaries via standard OTel context propagation. Its open-source core and self-hostable deployment model make it a sensible choice for organizations with data residency requirements or strong preferences against vendor-managed telemetry. Deterministic trace ID derivation from external request IDs enables cross-service correlation without coordination overhead, which matters more as the number of services grows.
MLflow automatically traces agent workflows and captures the full DAG, including parallel tool calls, conditional branches, and iterative reasoning loops. Its integration with the broader MLflow experiment tracking and model registry ecosystem makes it coherent for teams already managing models and experiments within that platform, where the appeal is consolidating observability into an existing system rather than introducing a separate one.
Datadog LLM Observability natively supports OTel GenAI conventions from v1.37 onward, mapping gen_ai.* attributes to its own schema automatically. It is the strongest fit for teams already running Datadog for infrastructure observability, where the value is not a new capability so much as one fewer platform to maintain.
Oso occupies a distinct position in this landscape. Rather than functioning purely as a debugging tool, Oso is a fine-grained authorization platform that has extended into AI-agent authorization and governance through its Oso for Agents offering. The design premise is that agents inherit human-scale access to systems and act on it at machine speed, which means controlling what each agent is permitted to do, and producing a complete record of those decisions across multi-step tool call chains, is a different problem from debugging model quality. For organizations where access control, policy enforcement, and governance are first-class requirements alongside observability, Oso addresses the authorization layer that tracing tools do not.
When evaluating any of these tools, four questions cut through the marketing: whether tool calls are first-class spans or flattened into the LLM span; whether the platform supports DAG-level capture for parallel agents; how it handles PII redaction in span attributes; and whether audit logs are exportable in a format that satisfies compliance requirements. The first two determine what failure modes are actually visible. The last two determine whether the telemetry is safe to produce and usable as evidence when something goes wrong.
Why a Complete Execution Trace Is the Prerequisite for Detecting Behavioral Violations
An agent operating across multi-step tool call chains can violate its intended behavior at any of dozens of decision points, and do so without producing an error, without exceeding a token budget, and without triggering any monitoring rule designed for single-call LLM outputs. That is the actual problem.
The MAST taxonomy's 14 failure modes are not edge cases. They are structural properties of how multi-step agents operate, distributed across specification errors, communication failures, and verification gaps with no single phase bearing a disproportionate share. A monitoring strategy that covers only the final output leaves most of the failure surface unobserved and, worse, gives the false impression of coverage.
Behavioral violations, an agent calling a tool it was not supposed to call, constructing arguments it should not have been able to construct, acting on stale or fabricated context, are only detectable through the complete execution record. The tool call span shows what was called and with what arguments. The reasoning span shows what plan the agent was executing at the time. The memory operation span shows what context it was drawing on. Without all three, the violation is invisible until its downstream effects become undeniable, at which point reconstruction from incomplete evidence is the only option, which is as unpleasant as it sounds.
The stakes of this shift materially as agents acquire broader access. An agent with read-only access to a single API is a bounded risk. An agent with write access to internal systems, delegated credentials, and the ability to invoke other agents is a different category of system and warrants a different category of oversight. The trace is what makes its behavior auditable continuously, not just retrospectively after a failure, as the standard of evidence for what the agent did, in what order, with what authorization, and to what effect. Everything else is guesswork.