LLM Observability Tooling Comparison for Agentic Pipelines
Six observability platforms compared on what actually catches silent agent failures.
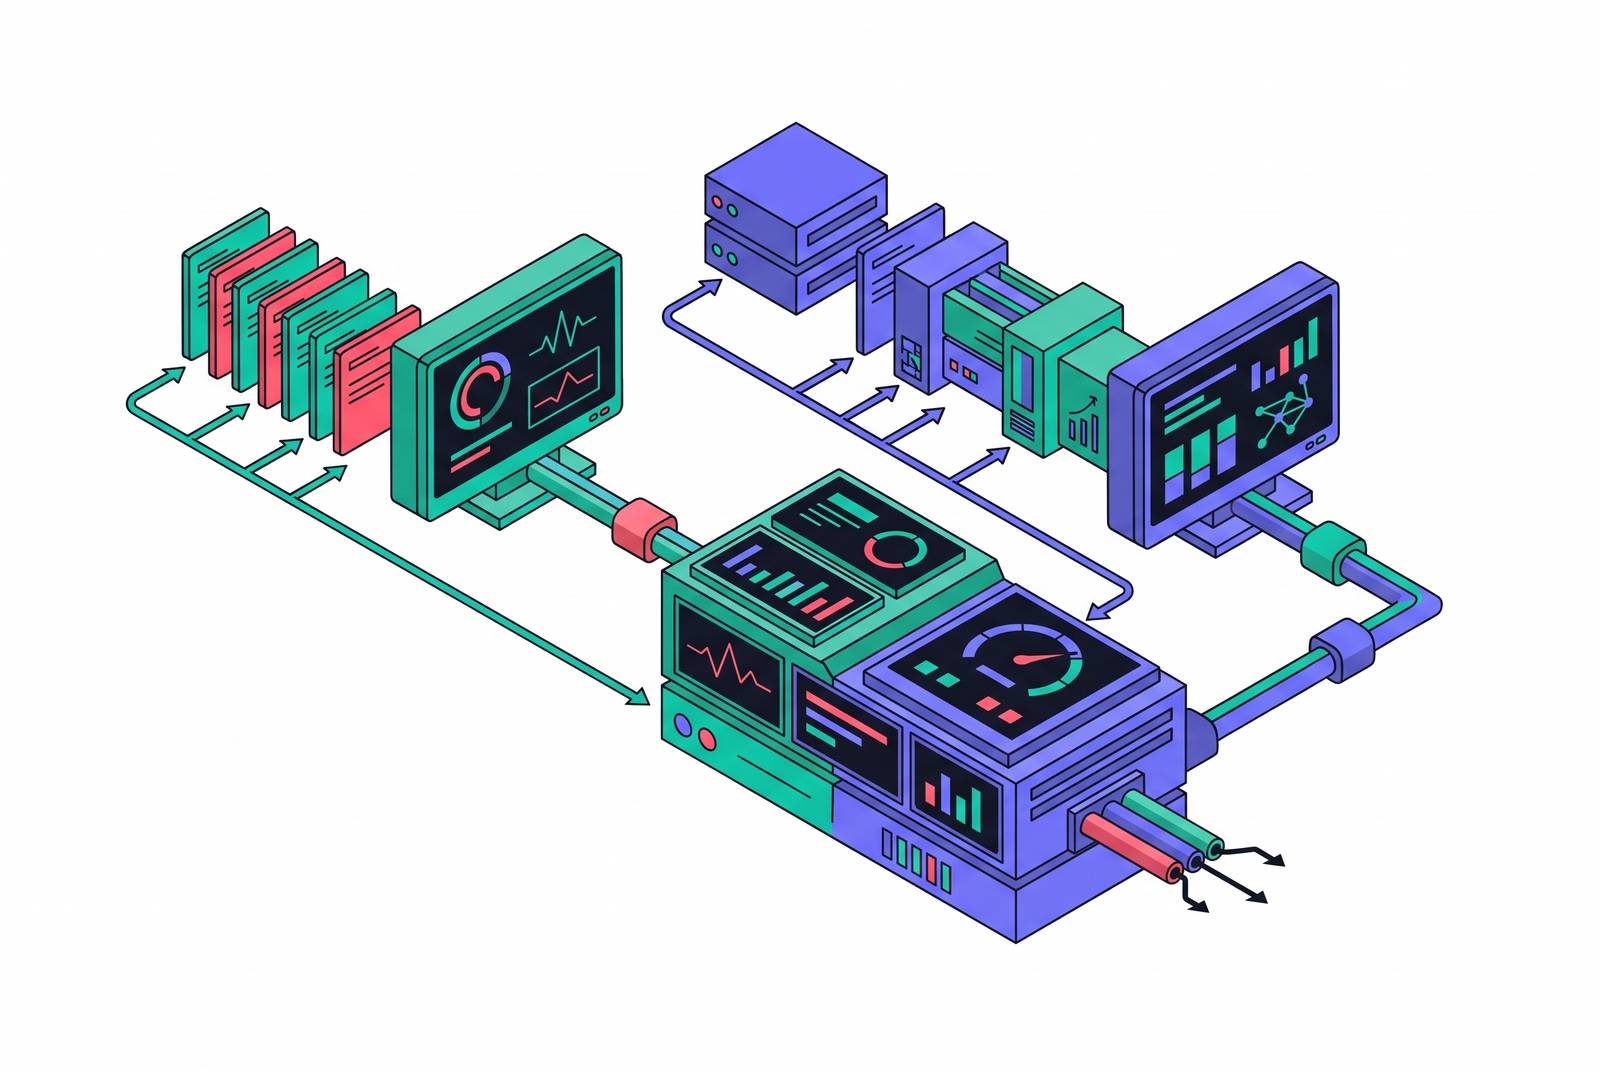
Agentic pipelines break the old rules of monitoring software. A single user request can now trigger five model calls, three tool invocations, and two vector lookups, and any one of those ten steps can fail silently while the dashboard stays green. This piece compares the observability platforms teams actually use to catch those failures: MLflow, LangSmith, Langfuse, Arize Phoenix, and the proxy tools Helicone and Portkey, and lays out which capabilities separate a real fix from a fancier log file.
The two observability categories and where most tools actually sit
Two different products get sold under the same "LLM observability" label, and mixing them up costs teams a migration later.
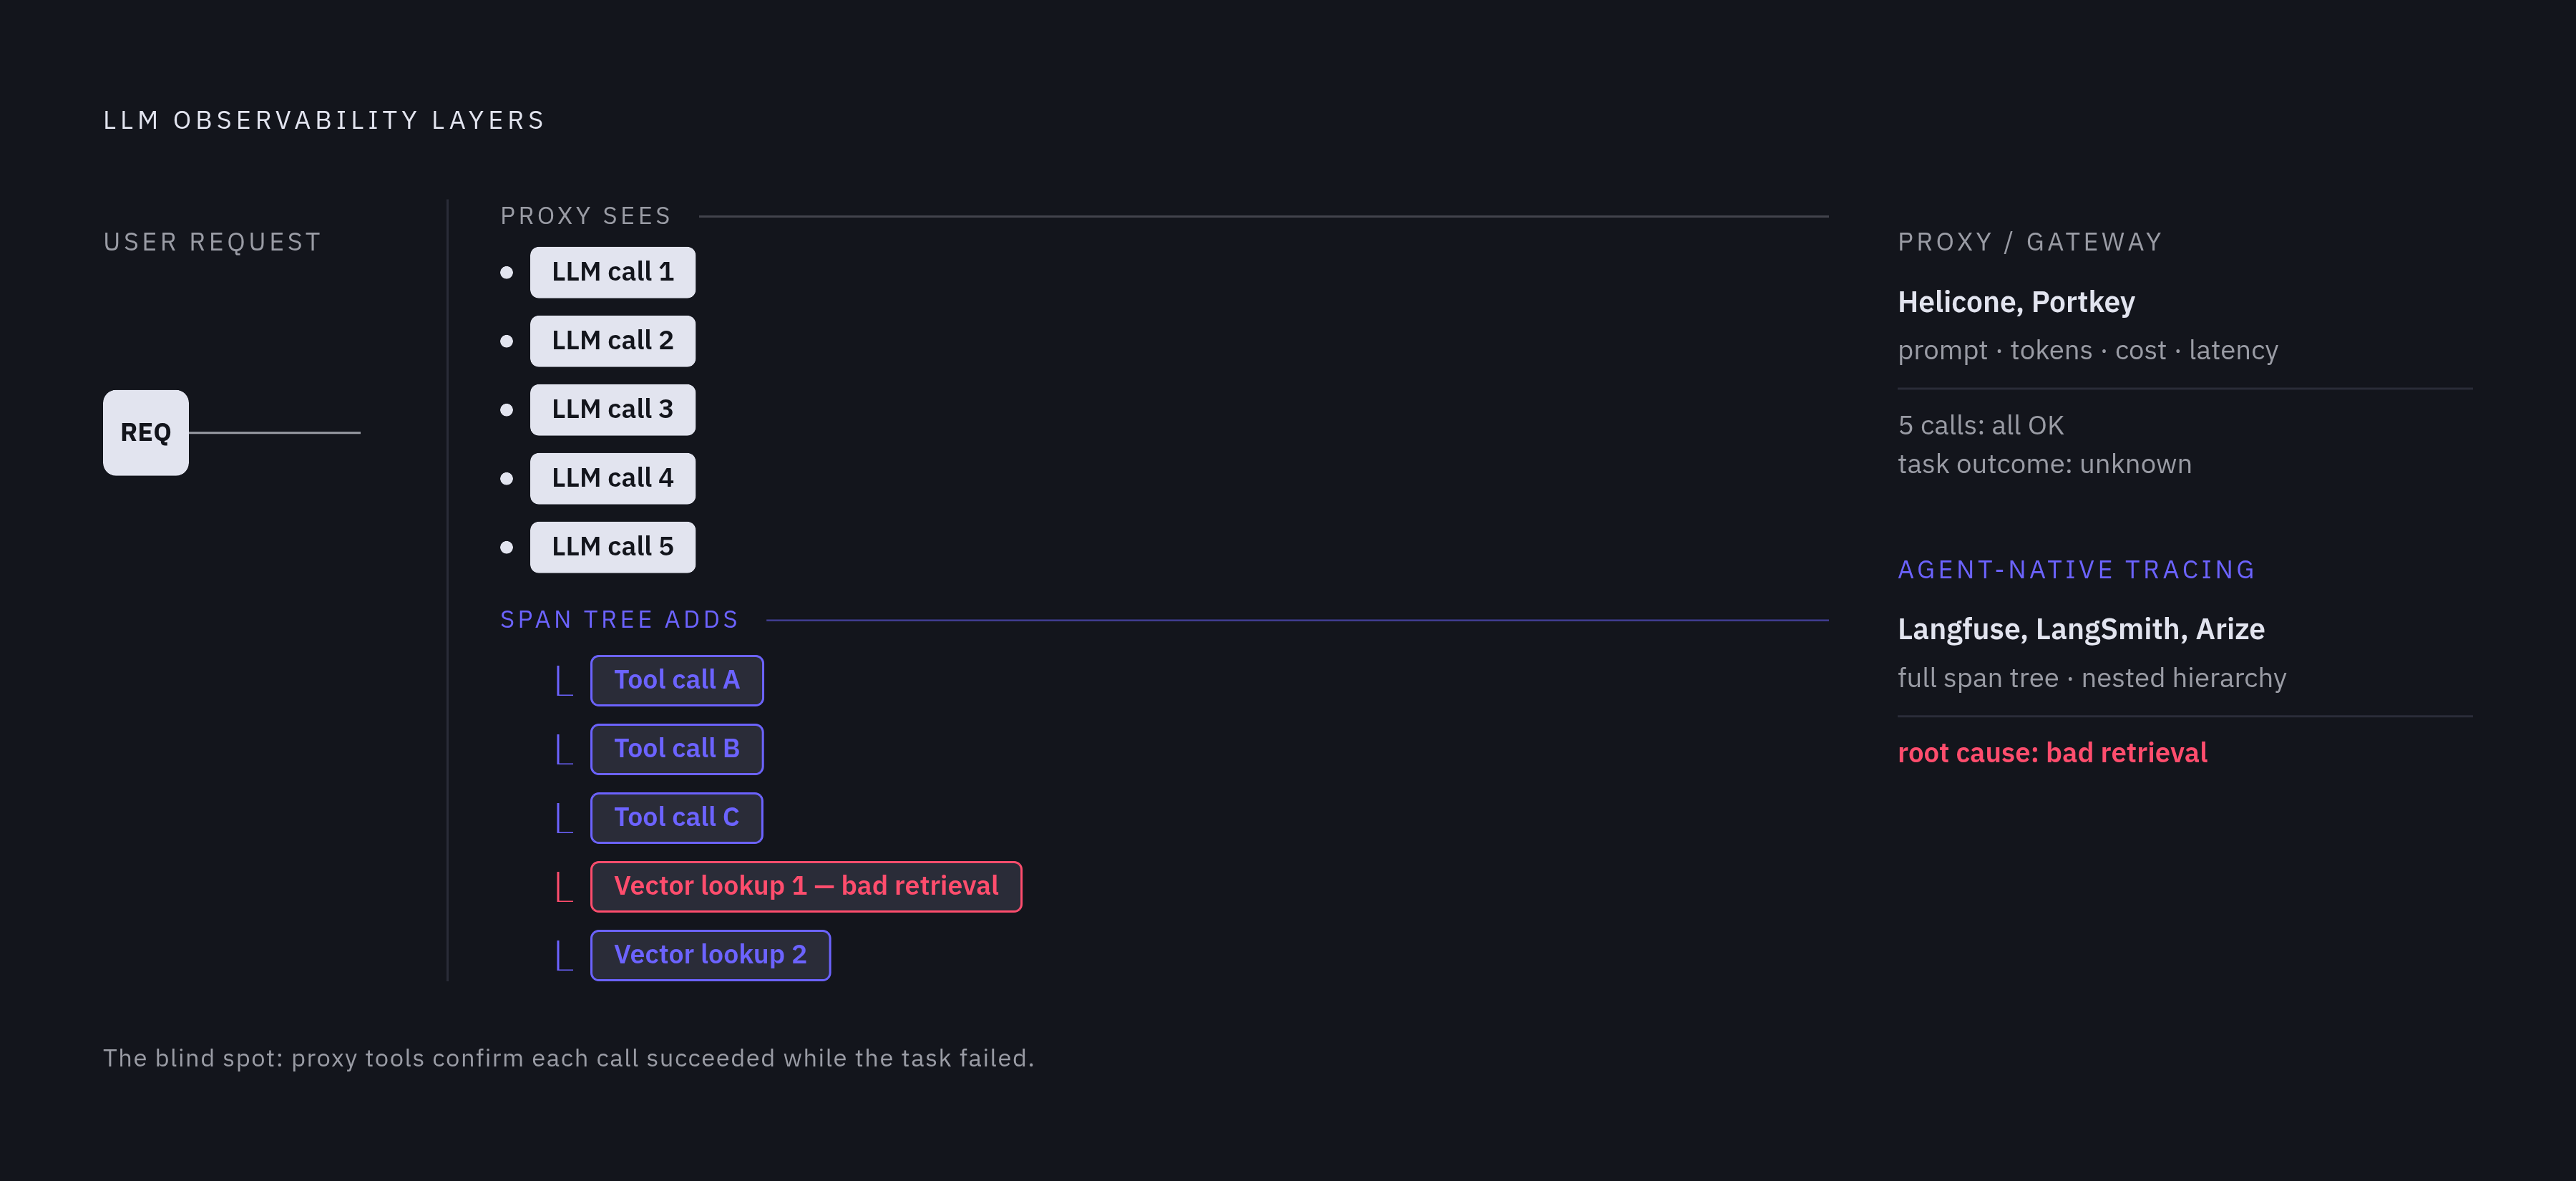
The first is plain LLM logging, using proxy or gateway tools that sit in front of a model call and record the prompt, the token count, the cost, and the latency. Setup takes minutes. Helicone and Portkey live here. They confirm a call happened. They do not tell you what led to it or what happened after.
The second is agent-native observability: SDK or standardized tracing-protocol-based tools that trace an entire multi-step run as a span tree, with the orchestration graph itself captured as structure, not just a row in a table. Langfuse, Arize Phoenix, and LangSmith all work this way. The nested hierarchy is the whole point, because it's what lets someone trace a bad answer back to the exact retrieval step or tool call that caused it.
Most tools marketed as "LLM observability" still stop at prompts, tokens, and latency. They can tell you something broke. They can't tell you why, because they don't carry the business context, the data lineage, or the governance rules the agent was operating under. Pick a proxy logger for a single-call chatbot and it's fine. Pick one for a five-step agent pipeline and the first unreproducible failure will force a rebuild. Neither category, on its own, covers runtime policy enforcement either, that capability operates at a different level from logging or tracing.
What OpenTelemetry's GenAI conventions standardize and where they still leave gaps
The OpenTelemetry GenAI Special Interest Group formed in April 2024 under the broader Semantic Conventions group, originally just to standardize how LLM client calls get traced. The scope has since grown to six layers, covering agent orchestration, MCP tool calling, content capture, and quality evaluation alongside basic call tracing.
What's actually standardized today: core attributes like gen_ai.system, gen_ai.request.model, gen_ai.usage.input_tokens, and gen_ai.usage.output_tokens, plus, when a team opts in, full capture of prompts, completions, tool calls, and tool results. Arize Phoenix's OpenInference extensions add tool_call_result.* fields on top of the core conventions.
Conventions for agent-specific concepts, tasks, actions, memory, agent-to-agent messaging, were drafted in 2025 and are moving through Development status (the successor label to what used to be called experimental) through 2026. A pending proposal would add formal conventions for tracing tasks, actions, agents, teams, artifacts, and memory as first-class span types.
Adoption is wide: Major cloud and observability vendors have adopted the GenAI conventions, and the broader market has been moving from proprietary tracing formats toward OpenTelemetry generally. But there's a real gap: the Model Context Protocol spread fast through 2025, and it introduced a specific problem nobody's solved yet, which is that traces from the agent side and traces from the MCP server side don't connect. No convention bridges them reliably right now. OTel alignment, at this point, is hygiene. It's not a selling point. Past the standard attributes, the real evaluation question asks what a tool does, particularly on policy enforcement and multi-agent session tracking.
The capability dimensions that actually separate tools for agentic use cases
Distributed tracing with span hierarchies is the floor, not the ceiling. Without nested spans wrapping each LLM call, tool invocation, retrieval, and reasoning step, root-causing a multi-step failure is close to impossible. Log lines alone won't do it.
Trace-level replay matters more than it sounds like it should. Agentic systems are non-deterministic, so a log description of what happened isn't enough. Exact reproduction of the call sequence, including which tools got invoked with which parameters, is now table stakes rather than a premium add-on.
Behavioral monitoring and reasoning monitoring need to run together, not separately. Watching only what an agent did, without any visibility into why it did it, misses the cases that matter most: the subtle prompt injection, the tool poisoned by a bad retrieval three steps earlier. Combining both layers catches nuanced attacks that behavioral logging alone walks right past.
Semantic evaluation has to go past latency and error rate. That means LLM-as-judge scoring run against a sample of production traffic, human annotation queues for the edge cases the judge model can't call confidently, and hallucination tracking broken out by domain and query type, since a support bot and a legal-summary bot fail in very different ways.
Tool call monitoring, meaning which tools got called, what parameters got passed, the success rate per tool, and how a tool's output shaped the next decision, is the layer that traditional APM products skip entirely. It's also usually where the actual bug lives.
Session tracking matters for anything with state across turns: support conversations, financial workflows, multi-turn planning. Treating each turn as an isolated request throws away the context needed to catch a slow drift into a wrong answer.
Runtime policy enforcement is a different animal from all of the above. It means catching and stopping a violation before it completes, not writing it to a log for someone to read Monday morning. That's a control-plane job, not an observability-backend job, and most of the tools in this comparison don't attempt it.
Governance artifacts round out the list: immutable audit logs, role-based access tied to actual organizational responsibility, PII redaction built into the instrumentation layer itself, and data residency controls. These show up the moment a compliance team gets a look at the deployment, and rarely before.
Cost attribution, finally, needs to work at the level of individual calls, broken out by agent type, use case, and retrieval step. Some platforms bill per observation (per trace, span, or score), and a single agent request with several tool calls can rack up a significant number of billable units. That math needs to get done before rollout, not after the invoice.
How MLflow positions itself for agentic pipelines
MLflow is open source and covers the full lifecycle in one system: experiment tracking, prompt versioning, trace replay, and LLM-as-a-Judge evaluation. It's the platform for a team that doesn't want to run one tool during development and a different one in production.
The agentic-specific pieces: span-level tracing across prompts, retrievals, tool calls, and outputs; trace replay for reproducing non-deterministic failures; judge-model evaluation configurable to sample somewhere between 10 and 20 percent of production traffic, a range meant to balance coverage against evaluation cost; and OpenTelemetry GenAI conventions as the underlying schema, so span shapes stay vendor-neutral.
MLflow's own published guide names itself the top overall pick for 2026, which is a vendor ranking itself first. Teams should check that against their own stack before taking it at face value. The realistic fit is a team already using MLflow for model tracking that wants one platform instead of three. The tradeoff is configuration overhead: as a hybrid experiment-and-production tool, it asks for more setup discipline than a purpose-built observability product, and it doesn't natively cover runtime policy enforcement.
LangSmith for teams running LangChain or LangGraph in production
LangSmith is built for one ecosystem, LangChain and LangGraph, and the depth of that integration isn't matched by anything else on this list, for that specific stack.
Traces include node-by-node state diffs, full execution graphs, breakdowns of model and tool calls, and replay against newer model versions. LangGraph Studio, the agent IDE built to work with LangSmith, lets a developer see the execution graph visually, set breakpoints mid-run, and edit state directly. Nothing else covers LangGraph workflows at that level of detail.
The funding trajectory says something about where enterprise money expects this space to go. LangChain raised a $25 million Series A in February 2024 at roughly a $200 million valuation. By October 2025 it closed a $125 million Series B led by IVP at a $1.25 billion valuation, with Databricks, Datadog, Cisco, ServiceNow, Workday, and Frontline Ventures all participating. That's a wide bench of enterprise infrastructure players betting on the same stack.
LangSmith supports OpenTelemetry and offers both LLM-as-judge and human evaluation for production scoring. The catch: step outside LangChain or LangGraph and most of what makes LangSmith worth using disappears. Framework-agnostic teams should treat it as a secondary option, not a default. For teams that have already standardized on LangGraph, though, the Studio IDE alone can be reason enough to pick it.
Langfuse for framework-agnostic teams with data residency requirements
One tool is open source under a permissive license, covering tracing, prompt management, and evaluation, and the same codebase runs whether it's self-hosted or on the vendor's managed cloud offering. That's an unusual guarantee in this space, where cloud and self-hosted versions of a product often quietly diverge.
The adoption numbers are large: more than 2,000 paying customers, over 20,000 GitHub stars, more than 26 million SDK installs a month, and more than 6 million Docker pulls. A significant share of Fortune 50 and 63 of the Fortune 500 use it.
A database vendor. announced its acquisition of Langfuse on January 16, 2026, alongside its own $400 million Series D, led by Dragoneer, valuing ClickHouse at $15 billion. Langfuse stays open source and self-hostable after the deal, and Cloud continues per the public roadmap as of the announcement.
Pricing runs on a per-unit model with a free tier that includes 50,000 observations and 30-day retention, a Core plan at $29 a month, a Pro plan at $199 a month, and self-hosting free for core features. The billing detail that actually matters for agentic workloads: Langfuse charges per trace, observation, or score, and one agent request with several tool calls can generate ten to thirty billable units on its own. Cost modeling against expected agent volume isn't optional here, it's the first thing to do before committing.
Evaluation runs on a dataset-and-score model rather than pass/fail assertions, and supports both continuous online evaluation of live traffic and human annotation queues. There's no automated agent or prompt optimization built in, so it's best understood as a visibility and prompt-management layer, not a full agent development platform. The strongest fit is an enterprise team that needs self-hosting for data residency or compliance reasons, or one running multiple frameworks that doesn't want to lock into a single ecosystem's tooling. Among teams running more than one observability platform at once, it's frequently the one that ends up as the default enterprise choice.
Arize Phoenix for RAG pipelines and retrieval quality monitoring
Arize Phoenix is open source, built on OpenTelemetry, and instrumented through OpenInference, which means traces work with existing tooling instead of locking into a proprietary format.
The product splits in two. Phoenix itself is self-hosted, local-first, and notebook-friendly, built tightly around OTel and OpenInference conventions. Arize AX is the enterprise SaaS version, connecting agent evaluation to live production observability and online scoring.
The difference from Langfuse comes down to workflow style. Phoenix leans toward offline experimentation and analysis. Langfuse leans toward evaluation integrated with production workflows. Neither approach is wrong, they're just built for different points in the development cycle.
Core capabilities include full tracing across every agent step (prompts, retrievals, tool calls, outputs), judge-model or human review scoring, and a Prompt IDE for iterating on prompt changes. It integrates well with LlamaIndex and other major agent frameworks.
Dynatrace announced a definitive agreement to acquire Arize for $915 million on August 13, 2026, expected to close later that quarter or early in Dynatrace's third fiscal quarter, pending regulatory review and standard closing conditions. What happens to Phoenix's product direction after the close hasn't been announced. Teams evaluating Phoenix now, particularly for RAG pipelines where catching retrieval quality decay or embedding drift early is the whole point, should treat that uncertainty as a real factor in the decision, not a footnote.
Proxy and gateway tools, Helicone and Portkey, and what they cover well
Helicone and Portkey solve a narrower problem than everything above, and they solve it well: capturing every LLM call, its prompt, its token count, its cost, its latency, with almost no instrumentation work. Drop in a proxy, point traffic through it, done.
What they don't do is capture the orchestration graph. A proxy sees each call as it passes through, but it has no concept of the tree structure connecting five model calls, three tool invocations, and two retrieval steps into one logical agent run. That's fine for a single-call use case. A support chatbot answering one question at a time doesn't need a span tree, it needs to know what each call cost and how long it took.
The moment a pipeline adds multi-step reasoning, chained tool calls, or any workflow where one bad step poisons the next three, gateway logging stops being enough. It'll show every call succeeded individually while the overall task failed, which is the exact blind spot that made basic APM useless for agents in the first place. Teams that need agent-level debugging should treat these tools as a complement, a cheap way to track spend and latency at the edge, not a substitute for a span-tree platform doing the deeper trace work underneath.